Support Questions
- Cloudera Community
- Support
- Support Questions
- kudu scan very slow
- Subscribe to RSS Feed
- Mark Question as New
- Mark Question as Read
- Float this Question for Current User
- Bookmark
- Subscribe
- Mute
- Printer Friendly Page
- Subscribe to RSS Feed
- Mark Question as New
- Mark Question as Read
- Float this Question for Current User
- Bookmark
- Subscribe
- Mute
- Printer Friendly Page
kudu scan very slow
- Labels:
-
Apache Kudu
Created on 01-22-2019 08:36 PM - edited 09-16-2022 07:05 AM
- Mark as New
- Bookmark
- Subscribe
- Mute
- Subscribe to RSS Feed
- Permalink
- Report Inappropriate Content
kudu1.7.0 in cdh 5.15
3 master nodes, 4c32g, ubuntu16.04
3 data nodes, 8c64g, 1.8T ssd, ubuntu16.04
It is a small table: project_spot, 5.93K records, 38 columns
I found some slow sql on it(more than 400ms), most time spend on MaterializeTupleTime
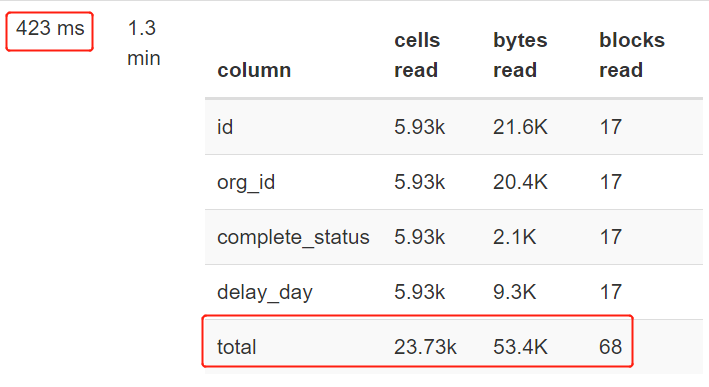
So i check the scan page on kudu tablet server web ui, and found this:
It is a very small scan, but spend 423ms, why?
More information:
I check the io performance on all data nodes using fio, no problem found:
read : io=6324.4MB, bw=647551KB/s, iops=161887, runt= 10001msec
There are 3 data nodes, only data02 has the problem.
I reboot the tablet server on data02, not work
Created 01-23-2019 12:10 PM
- Mark as New
- Bookmark
- Subscribe
- Mute
- Subscribe to RSS Feed
- Permalink
- Report Inappropriate Content
You might be able to find a trace of the ScanRequest RPC in the /rpcz endpoint of the web UI. Try running the scan and, if you observe it is slow, looking at /rpcz for the matching trace.
If that's too difficult, you can get all the traces dumped into the INFO log using the flag -rpc_dump_all_traces. Naturally this is very verbose on a busy server, but if you use the kudu tserver set_flag command you can turn the flag on and then turn it off a few seconds later, giving just enough time to capture the scan if you coordinate running the scan with turning on tracing. It's safe to change the flag at runtime in this way.
If you get a trace, please copy paste it in a reply here. It will help us understand where time is being spent.
You could also try gathering a trace of the tablet server when the slow scan runs. If you upload the trace file I can take a look at it.
See https://kudu.apache.org/docs/troubleshooting.html#kudu_tracing for more information on how to gather traces.
Created on 01-25-2019 12:50 AM - edited 01-25-2019 12:52 AM
- Mark as New
- Bookmark
- Subscribe
- Mute
- Subscribe to RSS Feed
- Permalink
- Report Inappropriate Content
Sorry to reply late, and thanks a lot for your attention
Here is the sql:
SELECT user_id, team_id, name, pile_no_prefix, version FROM project_spot order by version LIMIT 7
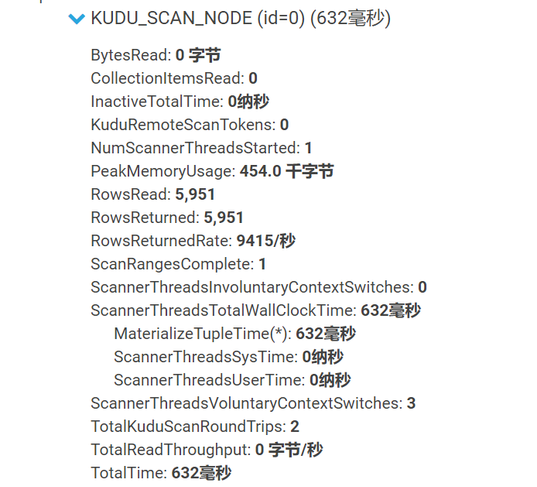
Here is the trace in cm:
Here is the picture in kudu web ui scan page:
Here is the tace in kudu rpcz page:
{
	"header": {
		"call_id": 23,
		"remote_method": {
			"service_name": "kudu.tserver.TabletServerService",
			"method_name": "Scan"
		},
		"timeout_millis": 9999
	},
	"trace": "0125 16:44:14.197738 (+     0us) service_pool.cc:163] Inserting onto call queue\n0125 16:44:14.197757 (+    19us) service_pool.cc:222] Handling call\n0125 16:44:14.197852 (+    95us) tablet_service.cc:1745] Creating iterator\n0125 16:44:14.198093 (+   241us) tablet_service.cc:1789] Iterator init: OK\n0125 16:44:14.198096 (+     3us) tablet_service.cc:1838] has_more: true\n0125 16:44:14.198097 (+     1us) tablet_service.cc:1853] Continuing scan request\n0125 16:44:14.198101 (+     4us) tablet_service.cc:1901] Found scanner a7c9ec89e70c4a65aed5da01e9c846cb\n0125 16:44:14.708182 (+510081us) tablet_service.cc:1960] Deadline expired - responding early\n0125 16:44:14.708296 (+   114us) inbound_call.cc:157] Queueing success response\n",
	"duration_ms": 510,
	"metrics": [
		{
			"key": "delta_iterators_relevant",
			"value": 1
		},
		{
			"key": "cfile_cache_hit",
			"value": 14
		},
		{
			"key": "cfile_cache_hit_bytes",
			"value": 289477
		},
		{
			"key": "threads_started",
			"value": 1
		},
		{
			"key": "thread_start_us",
			"value": 29
		},
		{
			"key": "compiler_manager_pool.queue_time_us",
			"value": 62
		},
		{
			"key": "compiler_manager_pool.run_cpu_time_us",
			"value": 110612
		},
		{
			"key": "compiler_manager_pool.run_wall_time_us",
			"value": 110623
		}
	]
}
Created 01-25-2019 03:18 PM
- Mark as New
- Bookmark
- Subscribe
- Mute
- Subscribe to RSS Feed
- Permalink
- Report Inappropriate Content
One thing that is clearly happening here is that Kudu is sending much more data than is necessary back to Impala. You specified LIMIT 7, but Kudu doesn't support server-side limits until CDH6.1. For such a small query, this might make things quite a bit faster.
Beyond that, I honestly don't see anything suspicious about the numbers from the Kudu side other than the scan took a long time given the amount of work involved. The trace shows nothing out of the ordinary; the metrics are fine. There weren't even cache misses, so everything came out of cache decoded + decompressed.
From the Impala profile, the only suspicious-looking thing is that two round trips were required. That shouldn't have been the case with LIMIT 7 as the first batch should have had more than 7 records in it.
If you run the scan a couple times in a row, does it get much faster? How does the time vary with the LIMIT amount?
Created 01-25-2019 06:45 PM
- Mark as New
- Bookmark
- Subscribe
- Mute
- Subscribe to RSS Feed
- Permalink
- Report Inappropriate Content
It's a small dict table with less then 6k records
The execution time of the sql doesnt change much when the limit amount varies, even no limit
The execution time of the sql doesnt change much when execute many times
I copied the table into a new one and execute that sql on the new table, the execute time and scan time is very low, about 5ms
By the way, I changed some kudu config to avoid a bug, under your colleague's advise: kudu compaction did not run
Is that the reason?
Created 01-28-2019 11:07 AM
- Mark as New
- Bookmark
- Subscribe
- Mute
- Subscribe to RSS Feed
- Permalink
- Report Inappropriate Content


