Support Questions
- Cloudera Community
- Support
- Support Questions
- Re: Java Profiling of long running MapReduce conta...
- Subscribe to RSS Feed
- Mark Question as New
- Mark Question as Read
- Float this Question for Current User
- Bookmark
- Subscribe
- Mute
- Printer Friendly Page
- Subscribe to RSS Feed
- Mark Question as New
- Mark Question as Read
- Float this Question for Current User
- Bookmark
- Subscribe
- Mute
- Printer Friendly Page
Java Profiling of long running MapReduce container
- Labels:
-
Apache Spark
-
MapReduce
Created on 05-19-2015 06:58 PM - edited 09-16-2022 02:29 AM
- Mark as New
- Bookmark
- Subscribe
- Mute
- Subscribe to RSS Feed
- Permalink
- Report Inappropriate Content
Hi dear community!
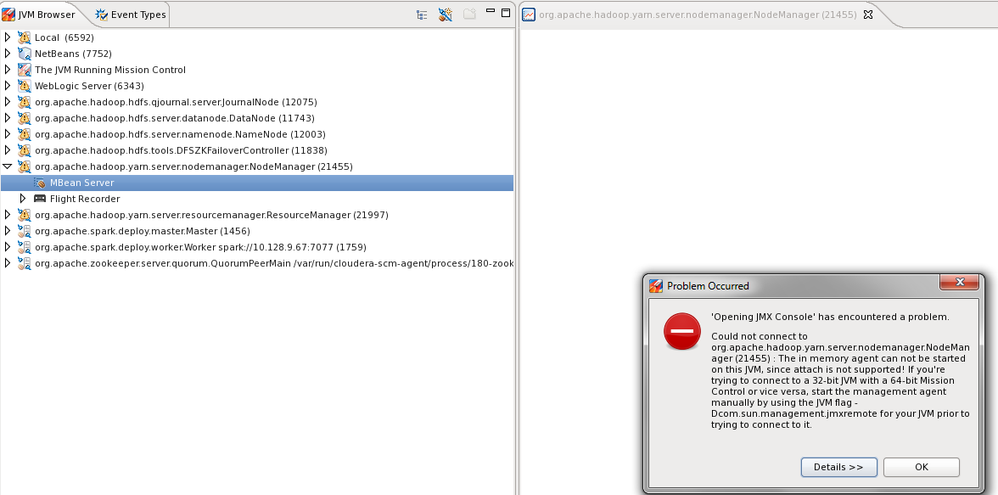
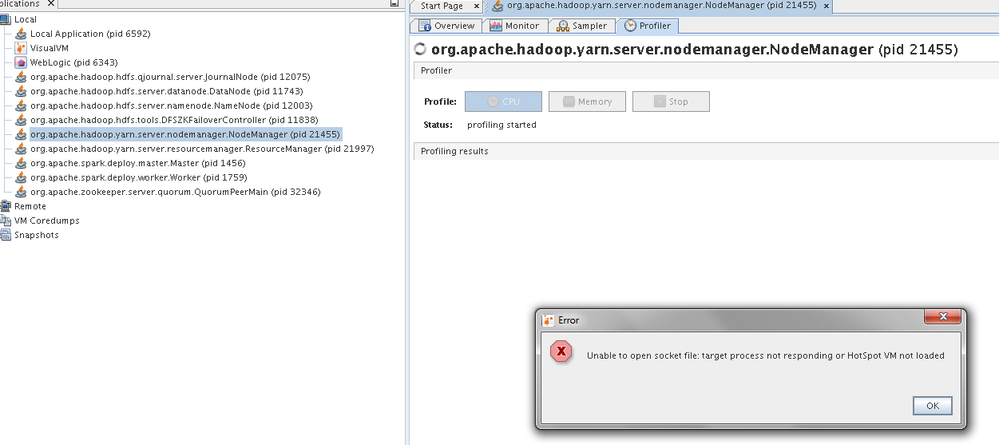
i tried to track MR container (mapper) through Java Mission Control (JMC) and through visualvm.
In both cases I got some error:
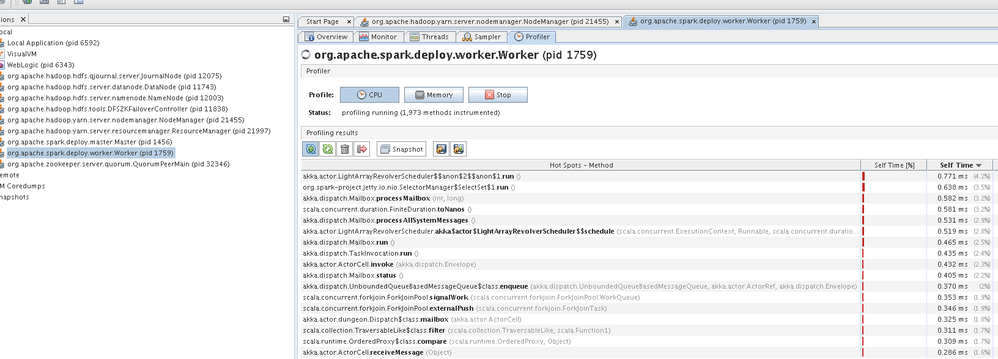
if i would profile spark - no problem.
Goal of this action to understand which Java classes consume much more CPU resource.
could anybody tell how to fix this profiling or which tool could show which Java Classes use much more resources in MR container.
also add example with visualvm with NodeManager (it doesn't works as well as MR container, and Spark worker profile - it's what i want to get)
what I want to get:
thanks in advance!
Created 05-20-2015 10:54 AM
- Mark as New
- Bookmark
- Subscribe
- Mute
- Subscribe to RSS Feed
- Permalink
- Report Inappropriate Content
Also, what user are you running the profiling tools?
Software Engineer, Cloudera Inc.
Created 05-20-2015 10:54 AM
- Mark as New
- Bookmark
- Subscribe
- Mute
- Subscribe to RSS Feed
- Permalink
- Report Inappropriate Content
Also, what user are you running the profiling tools?
Software Engineer, Cloudera Inc.
Created 05-21-2015 10:02 AM
- Mark as New
- Bookmark
- Subscribe
- Mute
- Subscribe to RSS Feed
- Permalink
- Report Inappropriate Content


