Our Community is getting an upgrade! To get everything ready for the relaunch, we’ll be placing the site in read-only mode starting September 21st.
We really appreciate your understanding while we get things set up behind the scenes. Catch up on all the exciting details about the move here.
Need help or have questions? Drop us a line at [email protected]

Community Articles

Find and share helpful community-sourced technical articles.
Announcements
Share your experience with Cloudera on G2 and get a $25 Amazon Gift card.
Hi, I'm CLEO! Something exciting is coming to the Community. Stay Tuned!

avatar

Shaun goes into great depth on all the capabilities of CML and DataViz in this blog, using a Python model or script.  Here, I'll write the script in R instead of the sample Python script Shaun shares.

There is no need to have an R script with predictive model capabilities.  While an R script with predictive model capabilities is an option, I'll demonstrate deploying a simple R script in CML that adds two columns together.

Step 1: Write your R script

As explained above, this script adds two columns together (assuming both columns are of type integer).  Within DataViz, we'll pass two columns (of type integer).  The cml_model wrapper is necessary with the PBJ runtime, as explained here.

  • Notice the "json" is what we'll be returning to DataViz, where we expect the "numbers_added" column
  • input[1] and input[2] are representing the two integer columns being passed
    library(cml)
    
        
    add_numbers <- cml_model(function(args) {
        json <-
    '{
        "data": {
            "colnames": [
                "numbers_added","tester"
            ],
            "coltypes": [
                "INT","STRING"
            ],
            "rows": [
            ]
        }
    }
    '
        
      mydf <- fromJSON(json)
      
      for(row in 1:nrow(args$data$rows)) {
            inputs = args$data$rows[row,]
            together <- matrix(list(inputs[1]+inputs[2]))
            mydf$data$rows <- rbind(mydf$data$rows, together)
    
      }
      
      mode(mydf$data$rows) <- "integer"
     
      return(mydf)
        
        
        })


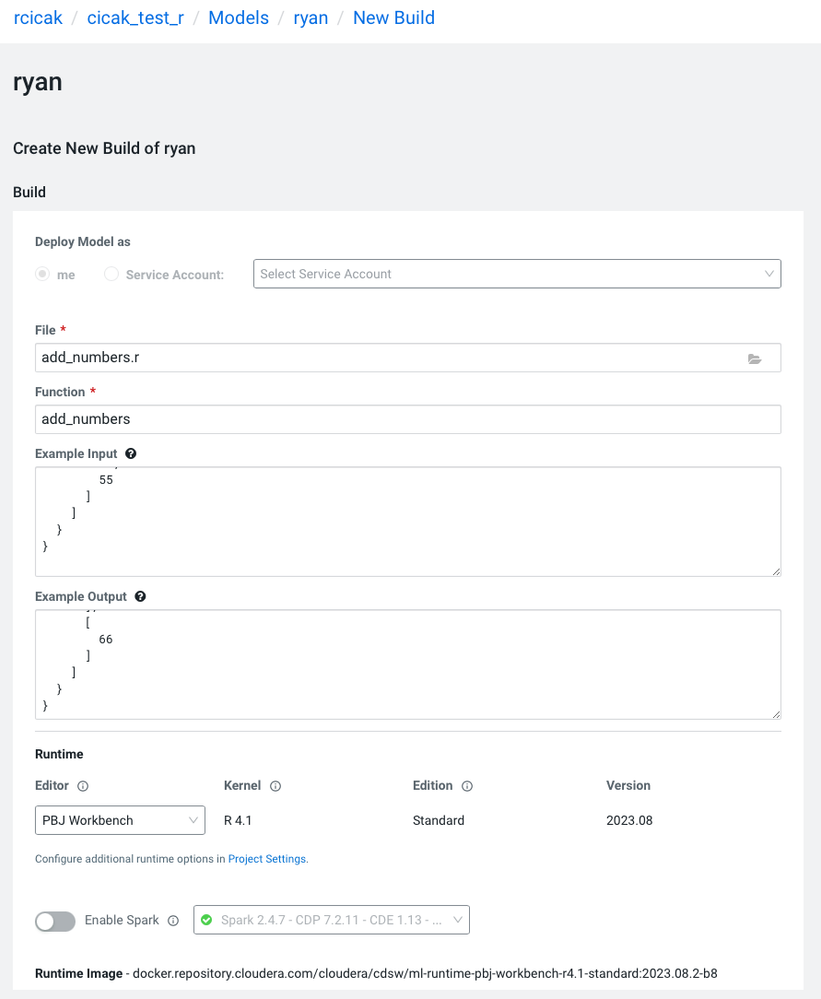
Step 2: Deploy your R script as a Model in CML

  • Notice PBJ as the runtimedeploy_r_model_in_cml.png

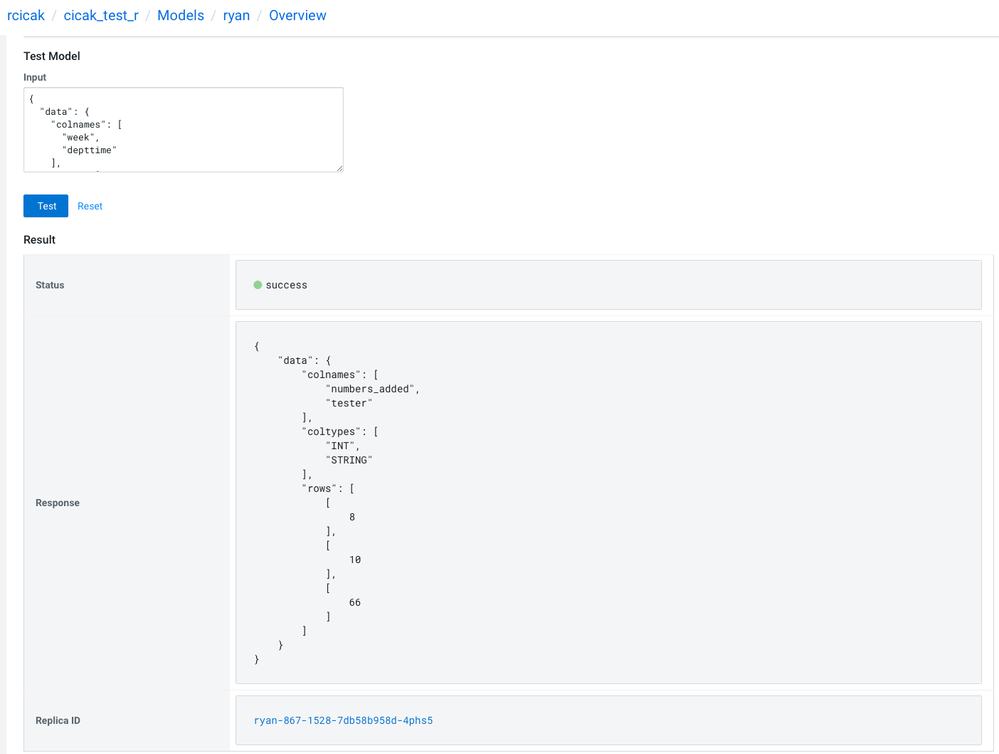
Step 3: Testing your deployed R script/model via CML and/or Postman

  • Below is the JSON input and output:
    {
      "data": {
        "colnames": [
          "week",
          "depttime"
        ],
        "rows": [
          [
            1,
            7
          ],
          [
            2,
            8
          ],
          [
            11,
            55
          ]
        ]
      }
    }

    output:

    {
        "data": {
            "colnames": [
                "numbers_added",
                "tester"
            ],
            "coltypes": [
                "INT",
                "STRING"
            ],
            "rows": [
                [
                    8
                ],
                [
                    10
                ],
                [
                    66
                ]
            ]
        }
    }


    test_r_model.png

    *The second column "tester" is required from DataViz (where you need more than one column returned)

Step 4: Build a Dataset in DataViz using your deployed model

  • Using my deployed model's URL and key, I'll plug this into the built-in function within DataViz, passing two columns: 
    https://modelservice.ml-b74f8940-b97.go01-dem.ylcu-atmi.cloudera.site/model
    {"accessKey":"mxyouraccesskey724mext3y8"}​
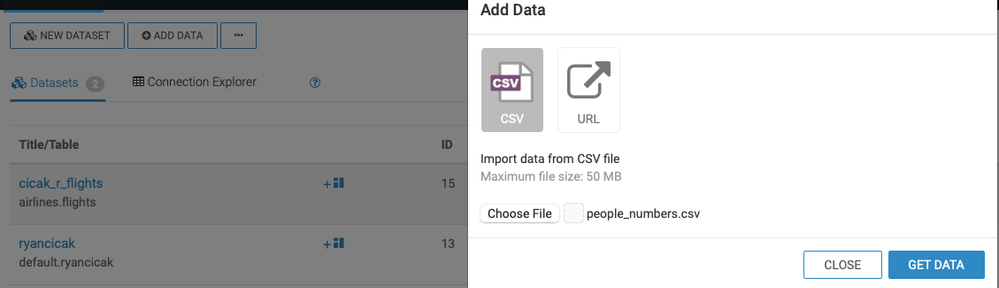
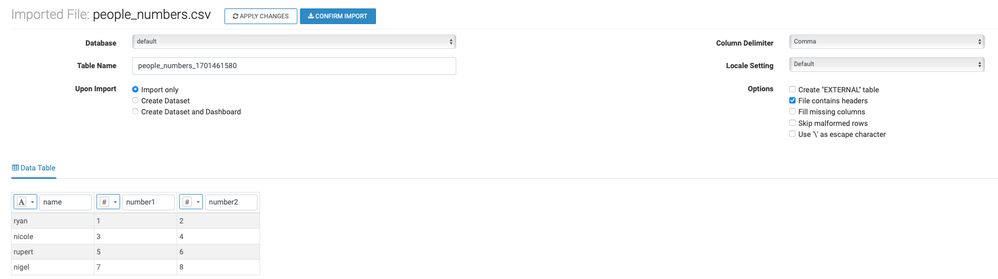
  •  Within DataViz, I'll upload my CSV file called "people_numbers.csv":
    name,number1,number2
    ryan,1,2
    nicole,3,4
    rupert,5,6
    nigel,7,8


  • Creating a new table based on the CSVimport_csv1.png

    import_csv2.png
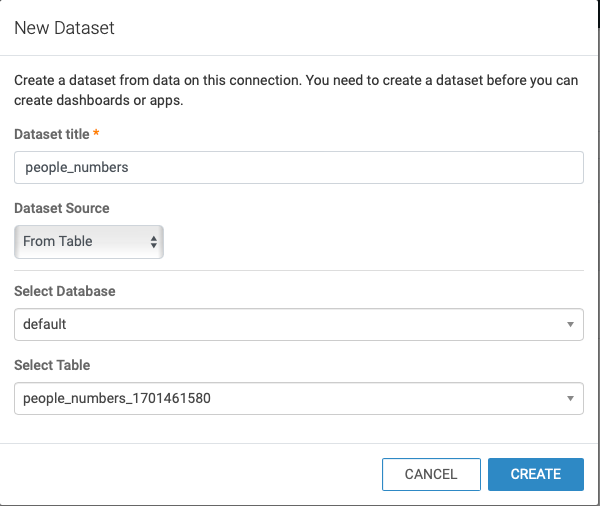
  • Dataset is created from the people_numbers table:
    people_numbers_dataset_created.png

Step 4: Modify the Dataset with a new column called "numbers_added", which will call the CML R model

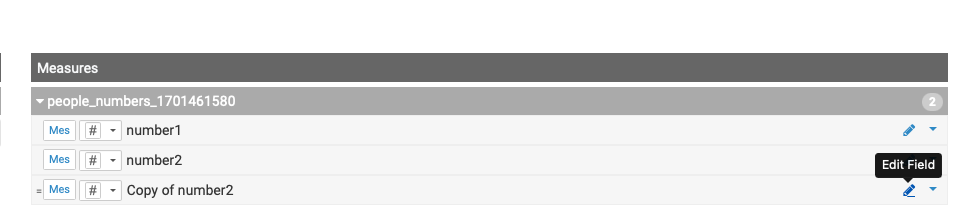
  •  Clone one of the measure columns (number1 or number2)clone_the_number2_for_our_new_column.png

    cloned.png
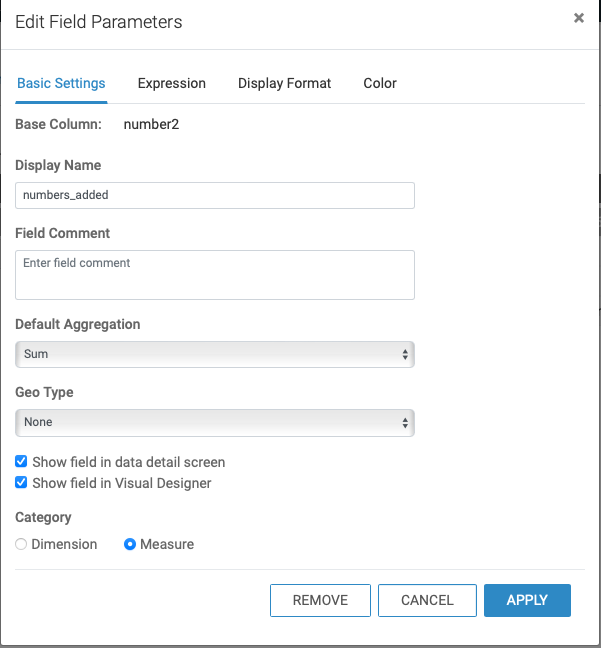
  • Edit the "Copy of number#" columnmodify_cloned_column.png
  • Change the column name to "numbers_added"rename.png
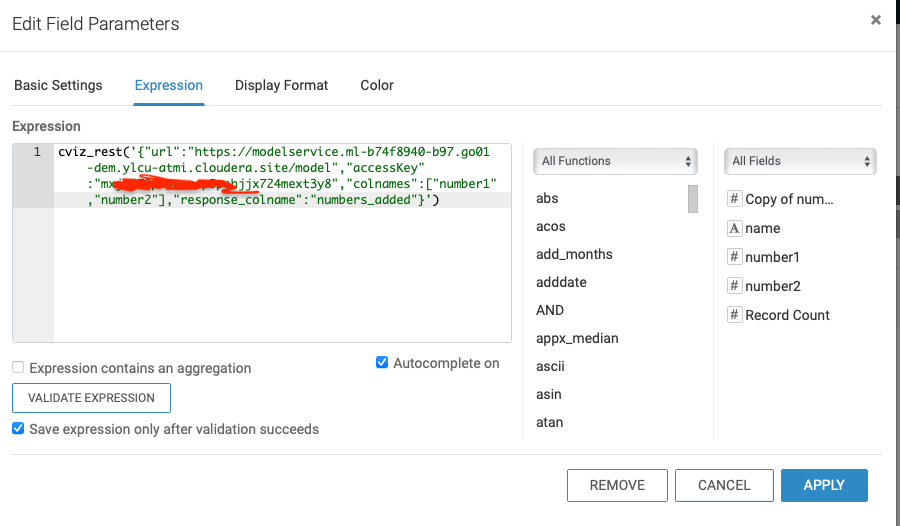
  • Go to the expression and enter the following then click "APPLY":
    cviz_rest('{"url":"https://modelservice.ml-b74f8940-b97.go01-dem.ylcu-atmi.cloudera.site/model","accessKey":"withyouraccesskey","colnames":["number1","number2"],"response_colname":"numbers_added"}')

    expression.png

  • Validate the numbers_added is defined as a Mes and #, then click "SAVE"click_save.png

Step 5: Add a dashboard with your dataset

  • Within the last step 4, click the "NEW DASHBOARD" buttonclick_new_dashboard.png
  • The new column "numbers_added" shows the results from the CML R model deployed within step 4. table_showing_columns.png
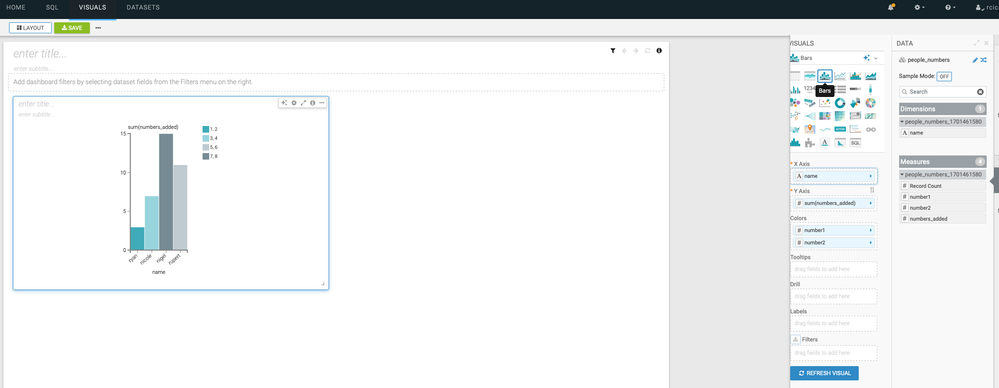
  • We're able to create visuals based on the dimensions and measures we choosemeasures_dimensions.png

That's it!  Feel free to import your own R script into CML as a model, and build charts/graphs within DataViz!

2,435 Views
0 Kudos
Version history
Last update:
‎04-20-2026 11:45 PM
Updated by: