Community Articles
- Cloudera Community
- Support
- Community Articles
- Collecting and Parsing Telemetry Events for new Da...
- Subscribe to RSS Feed
- Mark as New
- Mark as Read
- Bookmark
- Subscribe
- Printer Friendly Page
- Report Inappropriate Content
- Subscribe to RSS Feed
- Mark as New
- Mark as Read
- Bookmark
- Subscribe
- Printer Friendly Page
- Report Inappropriate Content
Created on
05-02-2016
05:22 PM
- edited on
02-26-2020
06:23 AM
by
SumitraMenon
When adding a net new data source to Metron, the first step is to decide how to push the events from the new telemetry data source into Metron. You can use a number of data collection tools and that decision is decoupled from Metron. However, we recommend evaluating Apache Nifi as it is an excellent tool to do just that (this article uses Nifi to push data into Metron). The second step is to configure Metron to parse the telemetry data source so that downstream processing can be done on it. In this article we will walk you through how to perform both of these steps.
In the previous article of this blog series, we described the following set of requirements for Customer Foo who wanted to add the Squid telemetry data source Into Metron.
- The proxy events from Squid logs need to be ingested in real-time.
- The proxy logs must be parsed into a standardized JSON structure that Metron can understand.
- In real-time, the squid proxy event must be enriched so that the domain names are enriched with the IP information.
- In real-time, the IP within the proxy event must be checked for threat intel feeds.
- If there is a threat intel hit, an alert needs to be raised.
- The end user must be able to see the new telemetry events and the alerts from the new data source.
- All of these requirements will need to be implemented easily without writing any new Java code.
In this article, we will walk you through how to perform steps 1, 2, and 6.
How to Parse the Squid Telemetry Data Source to Metron
The following steps guide you through how to add this new telemetry.
Step 1: Spin Up Single Node Vagrant VM
- Download the code from https://github.com/apache/incubator-metron/archive/codelab-v1.0.tar.gz.
- untar the file ( tar -zxvf incubator-metron-codelab-v1.0.tar.gz).
- Navigate to the metron-platform directory and build the package: incubator-metron-codelab-v1.0/metron-platform and build it (mvn clean package -DskipTests=true)
- Navigate to the codelab-platform directory: incubator-metron-codelab-v1.0/metron-deployment/vagrant/codelab-platform/
- Follow the instructions here: https://github.com/apache/incubator-metron/tree/codelab-v1.0/metron-deployment/vagrant/codelab-platf.... Note: The Metron Development Image is named launch_image.sh not launch_dev_image.sh.
Step 2: Create a Kafka Topic for the New Data Source
- ssh to your VM
- vagrant ssh
- Create a Kafka topic called "squid" in the directory /usr/hdp/current/kafka-broker/bin/:
cd /usr/hdp/current/kafka-broker/bin/
./kafka-topics.sh --zookeeper localhost:2181 --create --topic squid --partitions 1 --replication-factor 1
- List all of the Kafka topics to ensure that the new topic exists:
-
./kafka-topics.sh --zookeeper localhost:2181 --list
You should see the following list of Kafka topics:
- bro
- enrichment
- pcap
- snort
- squid
- yaf
Step 3: Install Squid
- Install and start Squid:
sudo yum install squid
sudo service squid start
- With Squid started, look at the the different log files that get created:
sudo su -
cd /var/log/squid
ls
You see that there are three types of logs available: access.log, cache.log, and squid.out. We are interested in access.log becasuse that is the log that records the proxy usage.
- Initially the access.log is empty. Let's generate a few entries for the log, then list the new contents of the access.log. The "-h 127.0.0.1" indicates that the squidclient will only use the IPV4 interface.
squidclient -h 127.0.0.1 http://www.hostsite.com
squidclient -h 127.0.0.1 http://www.hostsite.com
cat /var/log/squid/access.log
In production environments you would configure your users web browsers to point to the proxy server, but for the sake of simplicity of this tutorial we will use the client that is packaged with the Squid installation. After we use the client to simulate proxy requests, the Squid log entries should look as follows:
1461576382.642    161 127.0.0.1 TCP_MISS/200 103701 GET http://www.hostsite.com/ - DIRECT/199.27.79.73 text/html
1461576442.228    159 127.0.0.1 TCP_MISS/200 137183 GET http://www.hostsite.com/ - DIRECT/66.210.41.9 text/html
- Using the Squid log entries, we can determine the format of the log entires which is:
timestamp | time elapsed | remotehost | code/status | bytes | method | URL rfc931 peerstatus/peerhost | type
Step 4: Create a Grok Statement to Parse the Squid Telemetry Event
Now we are ready to tackle the Metron parsing topology setup.
- The first thing we need to do is decide if we will be using the Java-based parser or the Grok-based parser for the new telemetry. In this example we will be using the Grok parser. Grok parser is perfect for structured or semi-structured logs that are well understood (check) and telemetries with lower volumes of traffic (check).
- Next we need to define the Grok expression for our log. Refer to Grok documentation for additional details. In our case the pattern is:
WDOM [^(?:http:\/\/|www\.|https:\/\/)]([^\/]+) SQUID_DELIMITED %{NUMBER:timestamp} %{SPACE:UNWANTED} %{INT:elapsed} %{IPV4:ip_src_addr} %{WORD:action}/%{NUMBER:code} %{NUMBER:bytes} %{WORD:method} http:\/\/\www.%{WDOM:url}\/ - %{WORD:UNWANTED}\/%{IPV4:ip_dst_addr} %{WORD:UNWANTED}\/%{WORD:UNWANTED}
Notice the WDOM pattern (that is more tailored to Squid instead of using the generic Grok URL pattern) before defining the Squid log pattern. This is optional and is done for ease of use. Also, notice that we apply the UNWANTED tag for any part of the message that we don't want included in our resulting JSON structure. Finally, notice that we applied the naming convention to the IPV4 field by referencing the following list of field conventions.
- The last thing we need to do is to validate the Grok pattern to make sure it's valid. For our test we will be using a free Grok validator called Grok Constructor. A validated Grok expression should look like this:
- Now that the Grok pattern has been defined, we need to save it and move it to HDFS. Create a files called "squid" in the tmp directory and copy the Grok pattern into the file.
touch /tmp/squid
vi /tmp/squid
//copy the grok pattern above to the squid file
- Now put the squid file into the directory where Metron stores its Grok parsers. Existing Grok parsers that ship with Metron are staged under /apps/metron/patterns/.
su - hdfs
hdfs dfs -put /tmp/squid /apps/metron/patterns/
exit
Step 5: Create a Flux configuration for the new Squid Storm Parser Topology
- Now that the Grok pattern is staged in HDFS we need to define Storm Flux configuration for the Metron Parsing Topology. The configs are staged under /usr/metron/0.1BETA/config/topologies/ and each parsing topology has it's own set of configs. Each directory for a topology has a remote.yaml which is designed to be run on AWS and local/test.yaml designed to run locally on a single-node VM. Since we are going to be running locally on a VM we need to define a test.yaml for Squid. The easiest way to do this is to copy one of the existing Grok-based configs (YAF) and tailor it for Squid.
mkdir /usr/metron/0.1BETA/flux/squid
cp /usr/metron/0.1BETA/flux/yaf/remote.yaml /usr/metron/0.1BETA/flux/squid/remote.yaml
vi /usr/metron/0.1BETA/flux/squid/remote.yaml
- And edit your config to look like this (replaced yaf with squid and replace the constructorArgs section ):
name: "squid"
config:
    topology.workers: 1
components:
    -   id: "parser"
        className: "org.apache.metron.parsers.GrokParser"
        constructorArgs:
            - "/apps/metron/patterns/squid"
            - "SQUID_DELIMITED"
        configMethods:
            -   name: "withTimestampField"
                args:
                    - "timestamp"
    -   id: "writer"
        className: "org.apache.metron.parsers.writer.KafkaWriter"
        constructorArgs:
            - "${kafka.broker}"
    -   id: "zkHosts"
        className: "storm.kafka.ZkHosts"
        constructorArgs:
            - "${kafka.zk}"
    -   id: "kafkaConfig"
        className: "storm.kafka.SpoutConfig"
        constructorArgs:
            # zookeeper hosts
            - ref: "zkHosts"
            # topic name
            - "squid"
            # zk root
            - ""
            # id
            - "squid"
        properties:
            -   name: "ignoreZkOffsets"
                value: true
            -   name: "startOffsetTime"
                value: -1
            -   name: "socketTimeoutMs"
                value: 1000000
spouts:
    -   id: "kafkaSpout"
        className: "storm.kafka.KafkaSpout"
        constructorArgs:
            - ref: "kafkaConfig"
bolts:
    -   id: "parserBolt"
        className: "org.apache.metron.parsers.bolt.ParserBolt"
        constructorArgs:
            - "${kafka.zk}"
            - "squid"
            - ref: "parser"
            - ref: "writer"
streams:
    -   name: "spout -> bolt"
        from: "kafkaSpout"
        to: "parserBolt"
        grouping:
            type: SHUFFLE
Step 6: Deploy the new Parser Topology
- Deploy the new squid paser topology:
sudo storm jar /usr/metron/0.1BETA/lib/metron-parsers-0.1BETA.jar org.apache.storm.flux.Flux --filter /usr/metron/0.1BETA/config/elasticsearch.properties --remote /usr/metron/0.1BETA/flux/squid/remote.yaml
- If you currently have four topologies in Storm, you need to kill one to make a worker available for Squid. To do this, from the Storm UI, click the name of the topology you want to kill in the Topology Summary section, then click Kill under Topology Actions. Storm will kill the topology and make a worker available for Squid.
- Go to the Storm UI and you should now see new "squid" topology and ensure that the topology has no errors
Using Apache Nifi to Stream data into Metron
Put simply NiFi was built to automate the flow of data between systems. Hence it is a fantastic tool to collect, ingest and push data to Metron. The below instructions on how to install configure and create the nifi flow to push squid events into Metron.
Install, Configure and and Start Apache Nifi
The following shows how to install Nifi on the VM. Do the following as root:
- Download Nifi:
cd /usr/lib
wget  http://public-repo-1.hortonworks.com/HDF/centos6/1.x/updates/1.2.0.0/HDF-1.2.0.0-91.tar.gz
tar -zxvf HDF-1.2.0.0-91.tar.gz
- Edit Nifi Configuration to update the port of the nifi web app: nifi.web.http.port=8089
cd HDF-1.2.0.0/nifi
vi  conf/nifi.properties
//update nifi.web.http.port to 8089
- Install Nifi as service
bin/nifi.sh install nifi
- Start the Nifi Service
service nifi start
- Go to the Nifi Web: http://node1:8089/nifi/
Create a Nifi Flow to stream events to Metron
Now we will create a flow to capture events from squid and push them into metron
- Drag a processor to the canvas (do this by the dragging the processor icon..first icon)
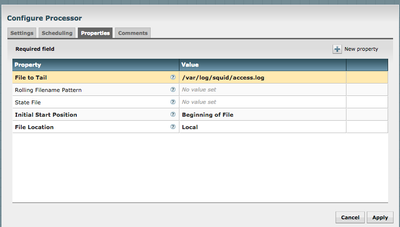
- Search for TailFile processor and select Add. Right click on the processor and configure. In settings tab change the name to "Ingest Squid Events"
- In properties, configure the following like the following:
-
- Drag Another Processor the canvas
- Search for PutKafka and select Add
- Right click on the processor and configure. In Settings, change names to "Stream to Metron” click the checkbox for failure and success for relationship.
- Under properties, set 3 properties
- Known Brokers: node1:6667
- Topic Name: squid
- Client Name: nifi-squid
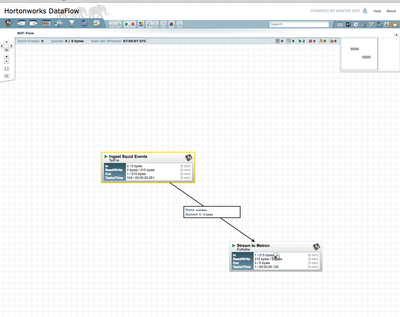
- Create a connection by dragging the arrow from Ingest Squid Events to Stream to Metron
- Select the entire Flow and click the play button (play button). you should see all processors green like the below:
- Generate some data using squidclient (do this for about 20+ sites)
squidclient http://www.hostsite.com
- You should see metrics on the processor of data being pushed into Metron.
- Look at the Storm UI for the parser topology and you should see tuples coming in
- After about 5 minutes, you should see a new Elastic Search index called squid_index* in the Elastic Admin UI
Verify Events are Indexed
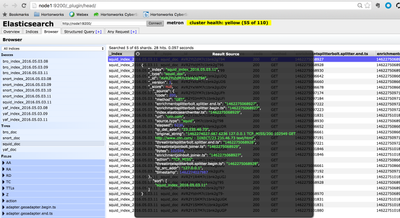
By convention the index where the new messages will be indexed is called squid_index_[timestamp] and the document type is squid_doc.
In order to verify that the messages were indexed correctly, we can use the elastic search Head plugin.
- Install the head plugin:
/usr/share/elasticsearch/bin/plugin -install mobz/elasticsearch-head/1.x
You should see the message: Installed mobz/elasticsearch-head/1.x into /usr/share/elasticsearch/plugins/head
2. Navigate to elastic head UI: http://node1:9200/_plugin/head/
3. Click on Browser tab and select squid doc on the left panel and then select one of the sample docs. You should see something like the following:
Configure Metron UI to view the Squid Telemetry Events
Now that we have Metron configured to parse, index and persist telemetry events and Nifi pushing data to Metron, lets now visualize this streaming telemetry data in the Metron UI.
- Go to the Metron UI.
- Add a New Pinned query
- Click the + to add new pinned query
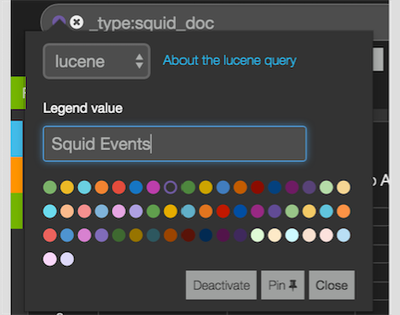
- Create a query: _type: squid_doc
- Click the colored circle icon, name the saved query and click Pin. See below
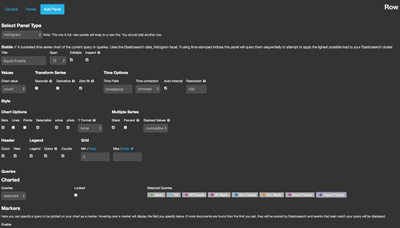
- Add a new histogram panel for the Squid events
- Click the add add panel + icon
- Select histogram panel type
- Set title as “Squid Events”
- Change Time Field to: timestamp
- Configure span to 12
- In the queries dropdown select “Selected” and only select the “Squid Events” pinned query
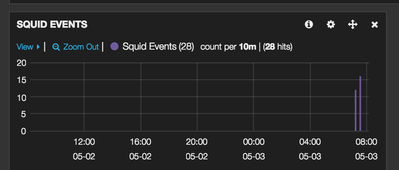
- Click Save and should see data in the histogram
- You should now see the new Squid events
What Next?
Created on 05-10-2016 03:08 PM
- Mark as Read
- Mark as New
- Bookmark
- Permalink
- Report Inappropriate Content
In sub-step 2 of Step 1 below the example does not match the tarball.
Step 1: Spin Up Single Node Vagrant VM
- Download the code from https://github.com/apache/incubator-metron/archive/codelab-v1.0.tar.gz
- untar the file ( tar -zxvf incubator-metron-codelab-v1.0.tar.gz)
Should be
tar -zxvf codelab-v1.0.tar.gz
Created on 05-10-2016 05:03 PM
- Mark as Read
- Mark as New
- Bookmark
- Permalink
- Report Inappropriate Content
@apsaltis When I downloaded the tar file it was named "incubator-metron-codelab-v1.0.tar.gz" which means the example to untar the file should be correct. Would you please check your download again to confirm that it is named "codelab-v1.0.tar.gz". Thanks!
Created on 05-10-2016 05:45 PM
- Mark as Read
- Mark as New
- Bookmark
- Permalink
- Report Inappropriate Content
Yeah worked just fine this time. Did wget against GH url directly, as my virus software kept blocking the GH url as it believes it is infected. Sorry for the noise.
Created on 05-10-2016 07:57 PM
- Mark as Read
- Mark as New
- Bookmark
- Permalink
- Report Inappropriate Content
After performing all of the steps in "Step 1: Spin Up Single Node Vagrant VM", Storm is up and running with 4 slots and 4 topologies running. The user is then left with the issue that was described here: no-workers-in-storm-for-squid-topology
Would it make sense to add another sub-step before sub-step 5 that instructs the user to add a port to the "supervisor.slots.ports:"[6700, 6701, 6702, 6703]" found in: metron-deployment/roles/ambari_config/vars/single_node_vm.yml ?
Created on 05-11-2016 11:05 PM
- Mark as Read
- Mark as New
- Bookmark
- Permalink
- Report Inappropriate Content
For: Install the head plugin
- usr/share/elasticsearch/bin/plugin -install mobz/elasticsearch-head/1.x
I think this should be:
1. sudo /usr/share/elasticsearch/bin/plugin -install mobz/elasticsearch-head/1.x
Created on 05-13-2016 09:41 PM
- Mark as Read
- Mark as New
- Bookmark
- Permalink
- Report Inappropriate Content
@apsaltis I'm modifying my previous reply. To deploy the new squid parser topology, you do not need to use "sudo" anywhere except at the very beginning of the command string. I tried it twice as is and it worked perfectly both times. Thank you for your feedback though. We really appreciate you taking the time to comment on the instructions so we can improve them.
Created on 05-13-2016 09:56 PM
- Mark as Read
- Mark as New
- Bookmark
- Permalink
- Report Inappropriate Content
, Thanks for your comment. I believe you're correct and we need an additional step to add a port. I'm researching the best way to add that port and I will modify that step when I have my results. Thanks for your help.
Created on 06-03-2016 07:56 PM
- Mark as Read
- Mark as New
- Bookmark
- Permalink
- Report Inappropriate Content
@apsaltis After some research I discovered the easiest way to ensure that Squid is assigned a worker is to kill one or more of the existing topologies. The Storm Supervisor will then assign one of the free workers to Squid. You can kill a topology either in the Storm UI or in the CLI. I will add a step to cover this in the article. Thanks again for your comments.
Created on 06-03-2016 08:03 PM
- Mark as Read
- Mark as New
- Bookmark
- Permalink
- Report Inappropriate Content
That certainly works. It has the same effect as adding an available port to Storm so that the new topology can be run. Not sure which is cleaner -- have a user kill another topology before deploying the squid one, update the canned storm config to have a port available, or have a user update the config and restart Storm and related services.


