


HDFS Forecast & Capacity Planning
The purpose of this document is how to leverage “R” to predict HDFS growth assuming we have access to the latest fsimage of a given cluster. This way we can forecast how much capacity would need to be added to the cluster ahead of time. In case of on-prem clusters, ordering H/W can be a lengthy process and for some organizations, it can take months till they can actually add capacity to their clusters. Giving teams managing Hadoop clusters an insight on HDFS growth rate can help with placing H/W orders ahead of time
A prereq. for this script, you would need access to a recent fsimage file, R and a machine with hadoop binaries installed on it to run OIV.
Example: hdfs oiv -i fsimage_xxxxx -p Delimited > fsimage.out
Loading required libraries
library(dplyr)
library(anytime)
library(lubridate)
library(prophet)
library(rmarkdown) --> only needed if you are using RStudio and planning on exporting the script to a PDF or Word format
Data Filtering & manipulation
The only three columns we need are Filesize, Replication and ModificationTime. Also by choozing FileSize > 0, removes all directories in the file from our calculation as well as zero size files.
files <- fsimage %>%
  filter(FileSize > 0) %>%
  select (FileSize, Replication, ModificationTime)
Here I am calculating actual file sizes on disk (file size * replication factor) and converting size to GB (not really required). Then filtering on which day I want to start my calculation from.
files_used <- mutate(files, RawSize = (((FileSize/1024)/1024)/1024) * Replication, MTime = anytime(ModificationTime)) %>%
  select (RawSize, MTime) %>%
  group_by(day=floor_date(MTime, "day")) %>%
  filter (day > '2017-04-01') %>%
  summarize(RawSize = sum(RawSize))
# Using Prophet library for prediction.
# Change column names for prophet to work
names(files_used)[1] <- "ds"
names(files_used)[2] <- "y"
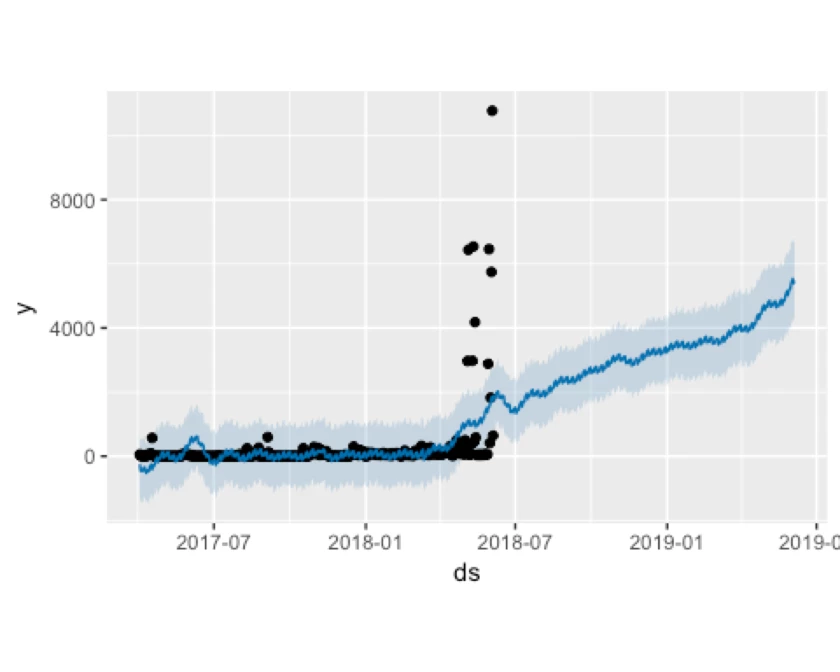
Based on all our data points, below graph shows the predicted usage over the next year.
m <- prophet(files_used, yearly.seasonality=TRUE)
future <- make_future_dataframe(m, periods = 365)
forecast <- predict (m, future)
## Plot Forecast
plot(m, forecast)
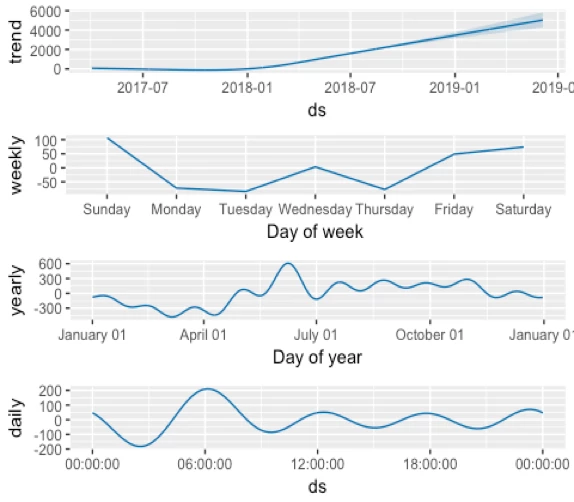
prophet_plot_components(m, forecast)
Percentage of HDFS files accessed in the last 30 days
files_used_access <- fsimage %>%
  filter(FileSize > 0) %>%
  select (FileSize, Path, ModificationTime)
x =  nrow(files_used_access)
files_access <- mutate(files_used_access, MTime = anytime(ModificationTime)) %>%
  select (Path, MTime) %>%
  filter(MTime > today() - days(30))
y = nrow(files_access)
z = (y / x) * 100
Percentage of files accessed in the last 30 days `r ceiling(z)`%
As an enhancement to this script would be using SparkR from a zeppelin notebook
Note: I am not R expert, I am just R curious 🙂 .