


Monitoring Apache Knox
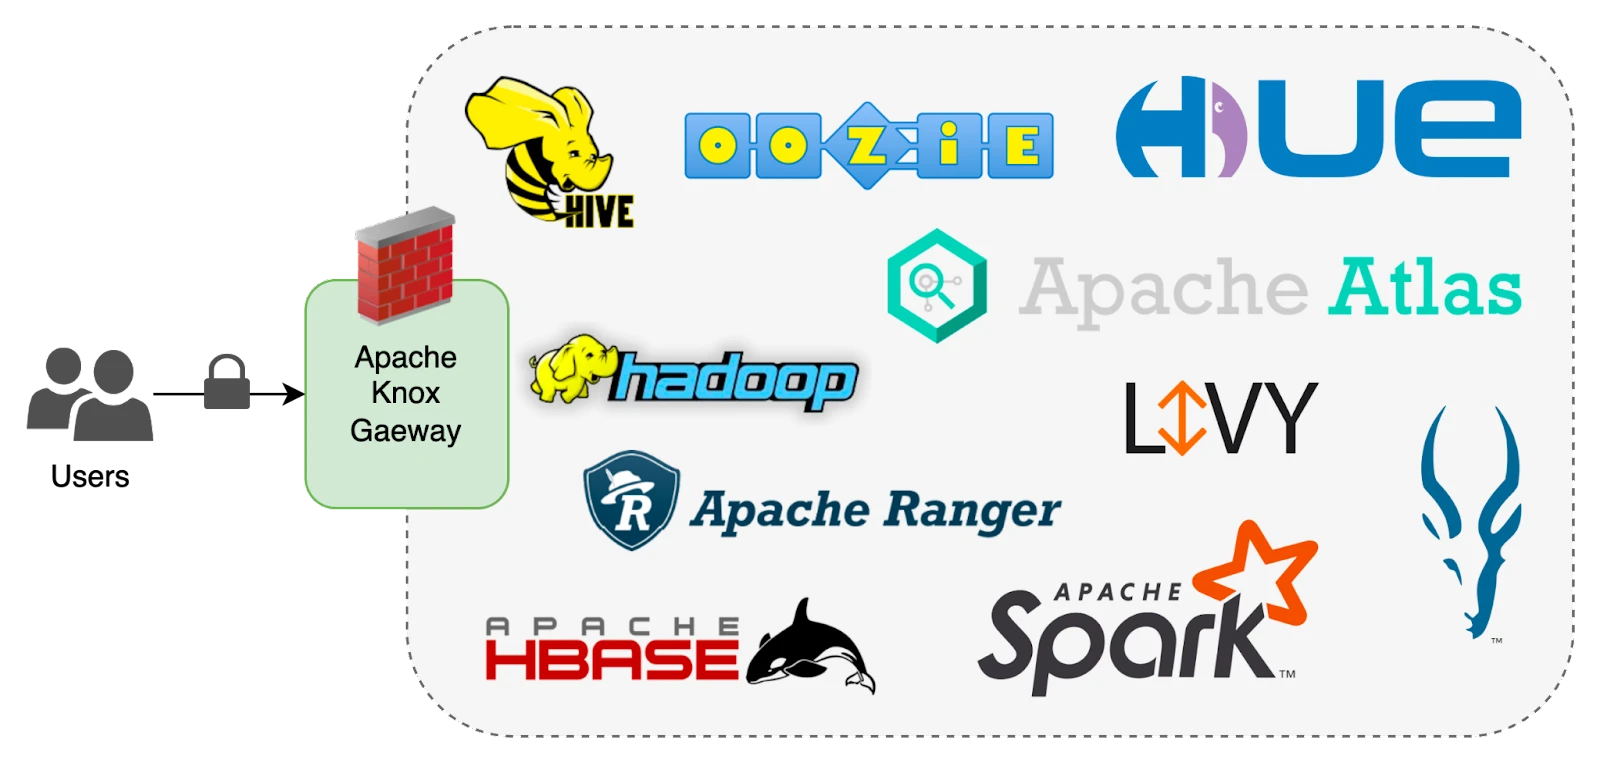
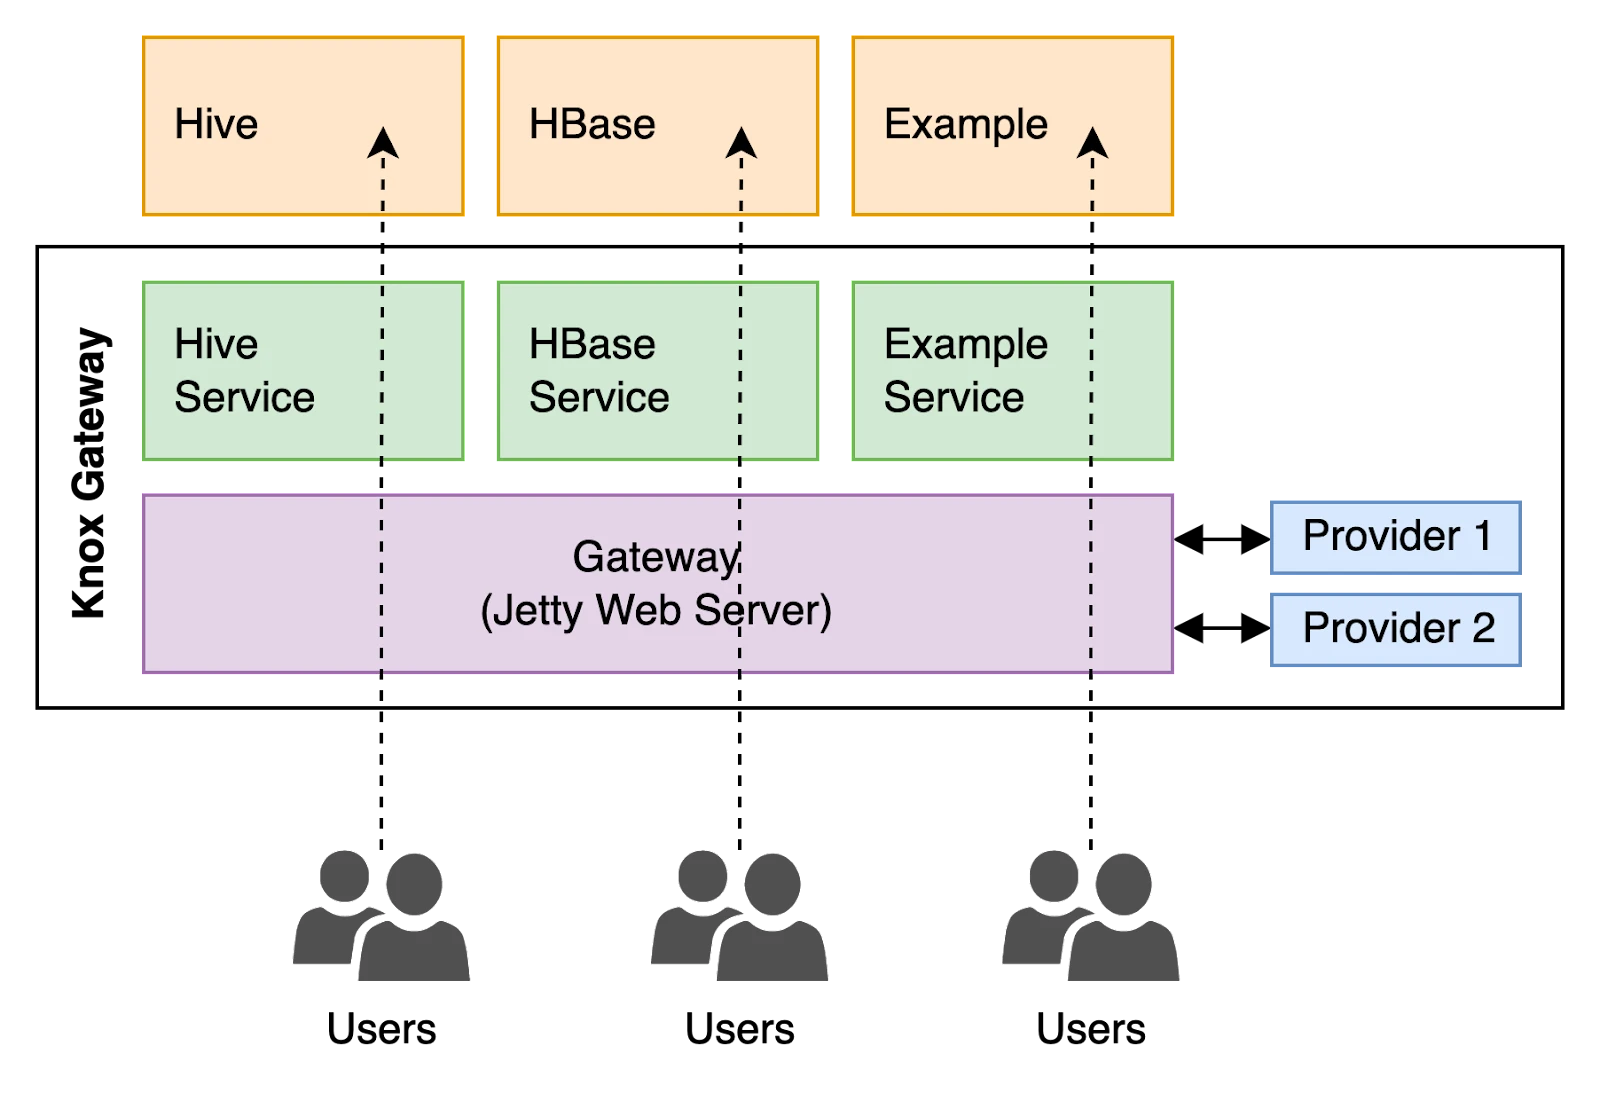
<topology>
    <gateway>
        <provider>
             <!-- provider definition here -->
       </provider>
       :
   </gateway>
   <service>
       <!-- service definition here -->
   </service>
   :
</topology>
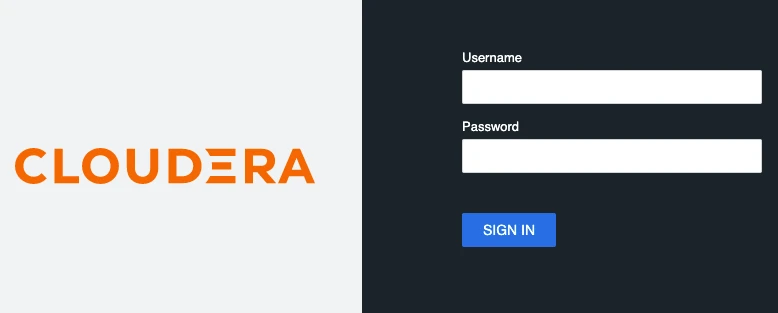
The screenshot below shows the Apache Knox login page:
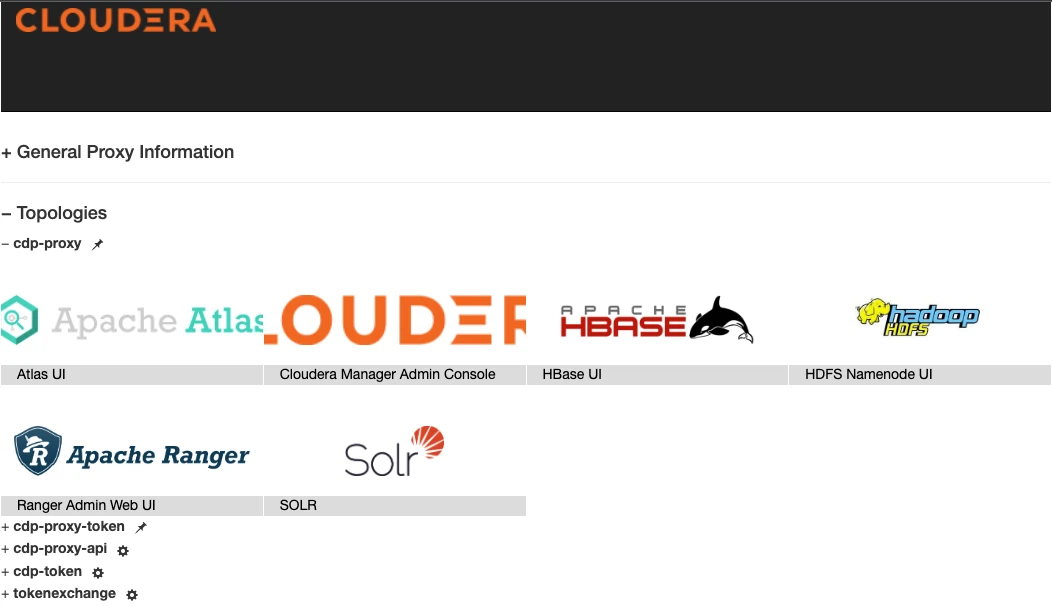
The next one is the main page, including all configured topologies. Note that in this example the cdp-proxy topology has been configured to provide access to Atlas, Cloudera Manager, HBase, NameNode, Ranger and Solr. To get access to this page, navigate to /gateway/homepage/home
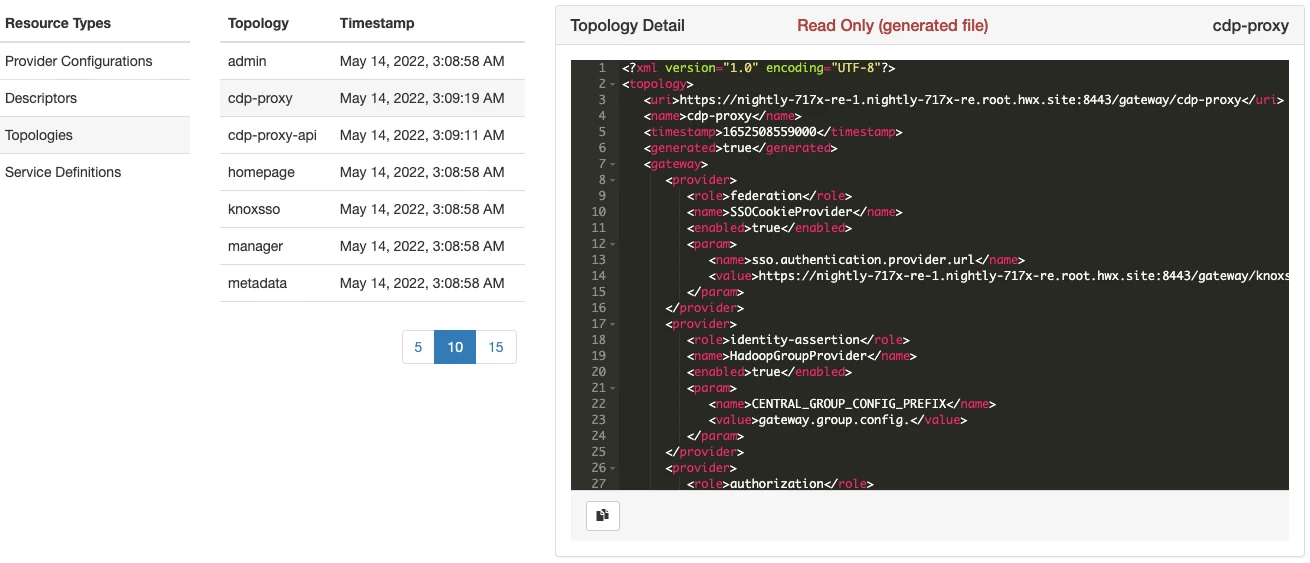
We can also access the admin page at /gateway/manager/admin-ui:
Enabling Metrics
Now that we know how Knox works and what a topology is, let's configure the metrics service.
The first step to accessing the Apache Knox metrics endpoint is enabling the metrics service. For this, it is necessary to implement a new topology, according to the example below:
Create a file at /var/lib/knox/gateway/conf/topologies/health.xml, adjusting to your needs.
<topology>
    <gateway>
        <provider>
            <role>authentication</role>
            <name>ShiroProvider</name>
            <enabled>true</enabled>
            <param>
                <name>main.pamRealm</name>
                <value>org.apache.knox.gateway.shirorealm.KnoxPamRealm</value>
            </param>
            <param>
                <name>main.pamRealm.service</name>
                <value>login</value>
            </param>
            <param>
                <name>sessionTimeout</name>
                <value>30</value>
            </param>
            <param>
                <name>urls./**</name>
                <value>authcBasic</value>
            </param>
        </provider>
        <provider>
            <role>authorization</role>
            <name>AclsAuthz</name>
            <enabled>false</enabled>
            <param>
                <name>knox.acl</name>
                <value>admin;*;*</value>
            </param>
        </provider>
        <provider>
            <role>identity-assertion</role>
            <name>HadoopGroupProvider</name>
            <enabled>true</enabled>
            <param>
                <name>CENTRAL_GROUP_CONFIG_PREFIX</name>
                <value>gateway.group.config.</value>
            </param>
        </provider>
    </gateway>
    <service>
        <role>HEALTH</role>
    </service>
</topology>
You can also duplicate a topology from the admin user interface and change the cloned topology as you need.
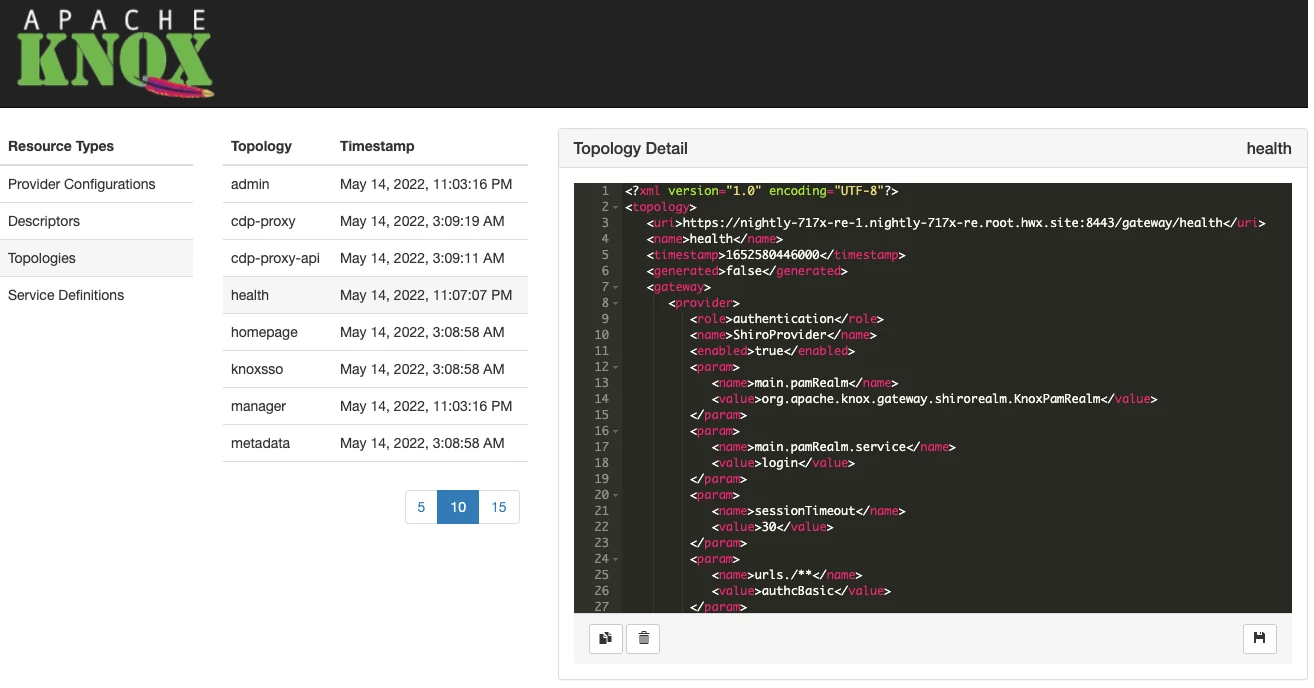
Now we can test the endpoint using the following command. Notice that the metrics are still empty.
$ curl -ku user:password "https://knox-server:8443/gateway/health/v1/metrics?pretty=true"
{
  "version" : "4.0.0",
  "gauges" : { },
  "counters" : { },
  "histograms" : { },
  "meters" : { },
  "timers" : { }
}
Enabling Metrics for Services
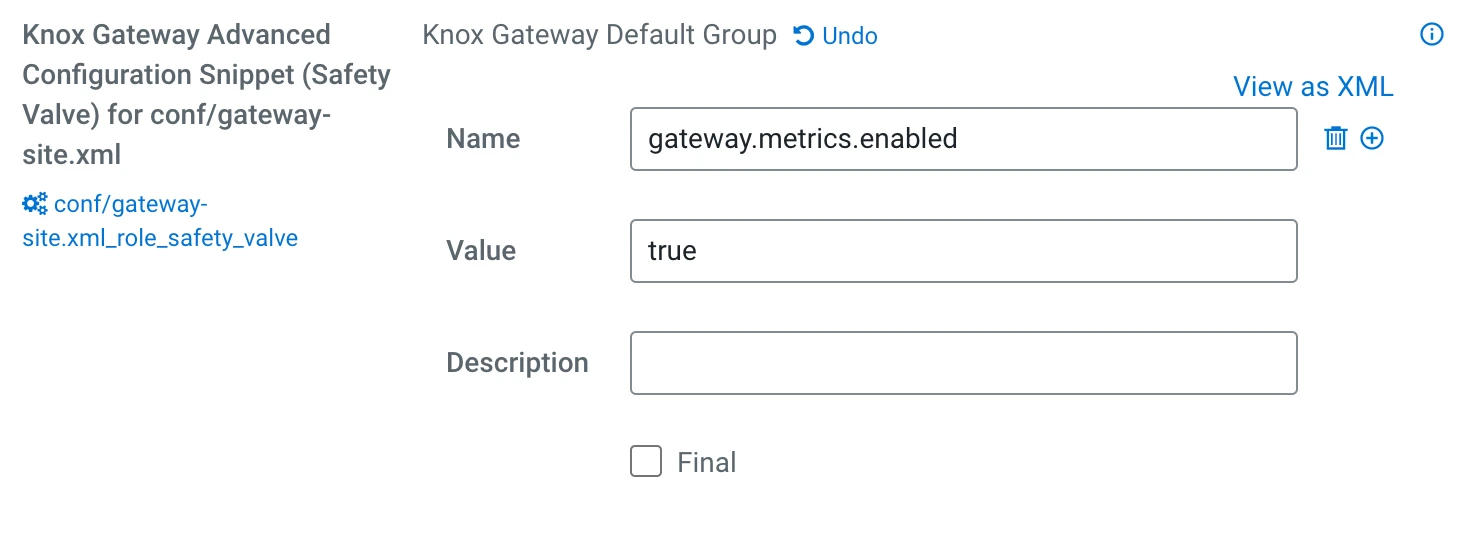
Now that we've enabled the endpoint to collect the metrics, it's time to produce the metrics. To do this, you need to enable the following properties in Cloudera Manager > Knox > Configuration:
Collecting the Metrics
Before collecting the metrics, we need to generate some traffic, otherwise no metrics will be produced on the endpoints. Briefly browse through Knox endpoints so that some metrics can be generated.
Finally, let's collect the metrics:
$ curl -ku knoxui:knoxui "https://knox-server:8443/gateway/health/v1/metrics?pretty=true"
{
  "version" : "4.0.0",
  "gauges" : {
    "PS-MarkSweep.count" : {
      "value" : 3
    },
    "PS-MarkSweep.time" : {
      "value" : 341
    },
    "PS-Scavenge.count" : {
      "value" : 34
    },
    "PS-Scavenge.time" : {
      "value" : 543
    },
    "blocked.count" : {
      "value" : 0
    },
    "count" : {
      "value" : 49
    },
    "daemon.count" : {
      "value" : 27
    },
    "deadlock.count" : {
      "value" : 0
    },
    "deadlocks" : {
      "value" : [ ]
    },
    "direct.capacity" : {
      "value" : 229778
    },
    "direct.count" : {
      "value" : 25
    },
    "direct.used" : {
      "value" : 229778
    },
    "heap.committed" : {
      "value" : 1008205824
    },
    "heap.init" : {
      "value" : 1073741824
    },
    "heap.max" : {
      "value" : 1008205824
    },
    "heap.usage" : {
      "value" : 0.1354310764227444
    },
    "heap.used" : {
      "value" : 136542400
    },
    "loaded" : {
      "value" : 14253
    },
    "mapped.capacity" : {
      "value" : 0
    },
    "mapped.count" : {
      "value" : 0
    },
    "mapped.used" : {
      "value" : 0
    },
    "name" : {
      "value" : "210554@nightly-71x-nu-1.nightly-71x-nu.root.hwx.site"
    },
    "new.count" : {
      "value" : 0
    },
    "non-heap.committed" : {
      "value" : 140599296
    },
    "non-heap.init" : {
      "value" : 2555904
    },
    "non-heap.max" : {
      "value" : -1
    },
    "non-heap.usage" : {
      "value" : -1.36887128E8
    },
    "non-heap.used" : {
      "value" : 136887128
    },
    "pools.Code-Cache.committed" : {
      "value" : 37879808
    },
    "pools.Code-Cache.init" : {
      "value" : 2555904
    },
    "pools.Code-Cache.max" : {
      "value" : 251658240
    },
    "pools.Code-Cache.usage" : {
      "value" : 0.1494166056315104
    },
    "pools.Code-Cache.used" : {
      "value" : 37601920
    },
    "pools.Compressed-Class-Space.committed" : {
      "value" : 10616832
    },
    "pools.Compressed-Class-Space.init" : {
      "value" : 0
    },
    "pools.Compressed-Class-Space.max" : {
      "value" : 1073741824
    },
    "pools.Compressed-Class-Space.usage" : {
      "value" : 0.009245157241821289
    },
    "pools.Compressed-Class-Space.used" : {
      "value" : 9926912
    },
    "pools.Metaspace.committed" : {
      "value" : 92102656
    },
    "pools.Metaspace.init" : {
      "value" : 0
    },
    "pools.Metaspace.max" : {
      "value" : -1
    },
    "pools.Metaspace.usage" : {
      "value" : 0.9702731699724273
    },
    "pools.Metaspace.used" : {
      "value" : 89364736
    },
    "pools.PS-Eden-Space.committed" : {
      "value" : 230686720
    },
    "pools.PS-Eden-Space.init" : {
      "value" : 268435456
    },
    "pools.PS-Eden-Space.max" : {
      "value" : 232783872
    },
    "pools.PS-Eden-Space.usage" : {
      "value" : 0.05936479998064471
    },
    "pools.PS-Eden-Space.used" : {
      "value" : 13819168
    },
    "pools.PS-Eden-Space.used-after-gc" : {
      "value" : 0
    },
    "pools.PS-Old-Gen.committed" : {
      "value" : 716177408
    },
    "pools.PS-Old-Gen.init" : {
      "value" : 716177408
    },
    "pools.PS-Old-Gen.max" : {
      "value" : 716177408
    },
    "pools.PS-Old-Gen.usage" : {
      "value" : 0.11489939654728679
    },
    "pools.PS-Old-Gen.used" : {
      "value" : 82288352
    },
    "pools.PS-Old-Gen.used-after-gc" : {
      "value" : 69268496
    },
    "pools.PS-Survivor-Space.committed" : {
      "value" : 61341696
    },
    "pools.PS-Survivor-Space.init" : {
      "value" : 44564480
    },
    "pools.PS-Survivor-Space.max" : {
      "value" : 61341696
    },
    "pools.PS-Survivor-Space.usage" : {
      "value" : 0.66009521484375
    },
    "pools.PS-Survivor-Space.used" : {
      "value" : 40491360
    },
    "pools.PS-Survivor-Space.used-after-gc" : {
      "value" : 40491360
    },
    "runnable.count" : {
      "value" : 8
    },
    "terminated.count" : {
      "value" : 0
    },
    "timed_waiting.count" : {
      "value" : 30
    },
    "total.committed" : {
      "value" : 1148805120
    },
    "total.init" : {
      "value" : 1076297728
    },
    "total.max" : {
      "value" : 1008205823
    },
    "total.used" : {
      "value" : 273550024
    },
    "unloaded" : {
      "value" : 20
    },
    "uptime" : {
      "value" : 7181810
    },
    "vendor" : {
      "value" : "AdoptOpenJDK OpenJDK 64-Bit Server VM 25.232-b09 (1.8)"
    },
    "waiting.count" : {
      "value" : 11
    }
  },
  "counters" : { },
  "histograms" : { },
  "meters" : { },
  "timers" : {
    "client./gateway/cdp-proxy-api/webhdfs/v1.GET-requests" : {
      "count" : 2,
      "max" : 2.345871303,
      "mean" : 1.2936517390995506,
      "min" : 0.27252996300000004,
      "p50" : 0.27252996300000004,
      "p75" : 2.345871303,
      "p95" : 2.345871303,
      "p98" : 2.345871303,
      "p99" : 2.345871303,
      "p999" : 2.345871303,
      "stddev" : 1.0365540554822608,
      "m15_rate" : 1.4747582595749215E-4,
      "m1_rate" : 1.2646567866717584E-52,
      "m5_rate" : 2.0046683275245812E-11,
      "mean_rate" : 2.8082304509532665E-4,
      "duration_units" : "seconds",
      "rate_units" : "calls/second"
    },
    "client./gateway/health/v1/metrics.GET-requests" : {
      "count" : 3,
      "max" : 1.6867495060000002,
      "mean" : 0.31597803,
      "min" : 0.31597803,
      "p50" : 0.31597803,
      "p75" : 0.31597803,
      "p95" : 0.31597803,
      "p98" : 0.31597803,
      "p99" : 0.31597803,
      "p999" : 0.31597803,
      "stddev" : 5.5409548260855284E-21,
      "m15_rate" : 4.943702006689124E-4,
      "m1_rate" : 8.06508251818969E-9,
      "m5_rate" : 1.8189077642291002E-4,
      "mean_rate" : 4.20218023620169E-4,
      "duration_units" : "seconds",
      "rate_units" : "calls/second"
    },
    "service./gateway/cdp-proxy-api/webhdfs/v1/.get-requests" : {
      "count" : 3,
      "max" : 0.009574565,
      "mean" : 0.007894472334077354,
      "min" : 0.005590579,
      "p50" : 0.008588437,
      "p75" : 0.009574565,
      "p95" : 0.009574565,
      "p98" : 0.009574565,
      "p99" : 0.009574565,
      "p999" : 0.009574565,
      "stddev" : 0.0017015385392143616,
      "m15_rate" : 2.2244612427544609E-4,
      "m1_rate" : 2.061840874032061E-52,
      "m5_rate" : 3.0575391686277505E-11,
      "mean_rate" : 4.213687720803925E-4,
      "duration_units" : "seconds",
      "rate_units" : "calls/second"
    }
  }
}
Conclusion
In this article we were able to see an overview of Apache Knox and also how to enable the metrics service. Once this service is active, it is possible to monitor the access statistics of Apache Knox and with that to foresee possible problems or bottlenecks in the access to the services.
To learn more about Apache Knox, please see the following links: