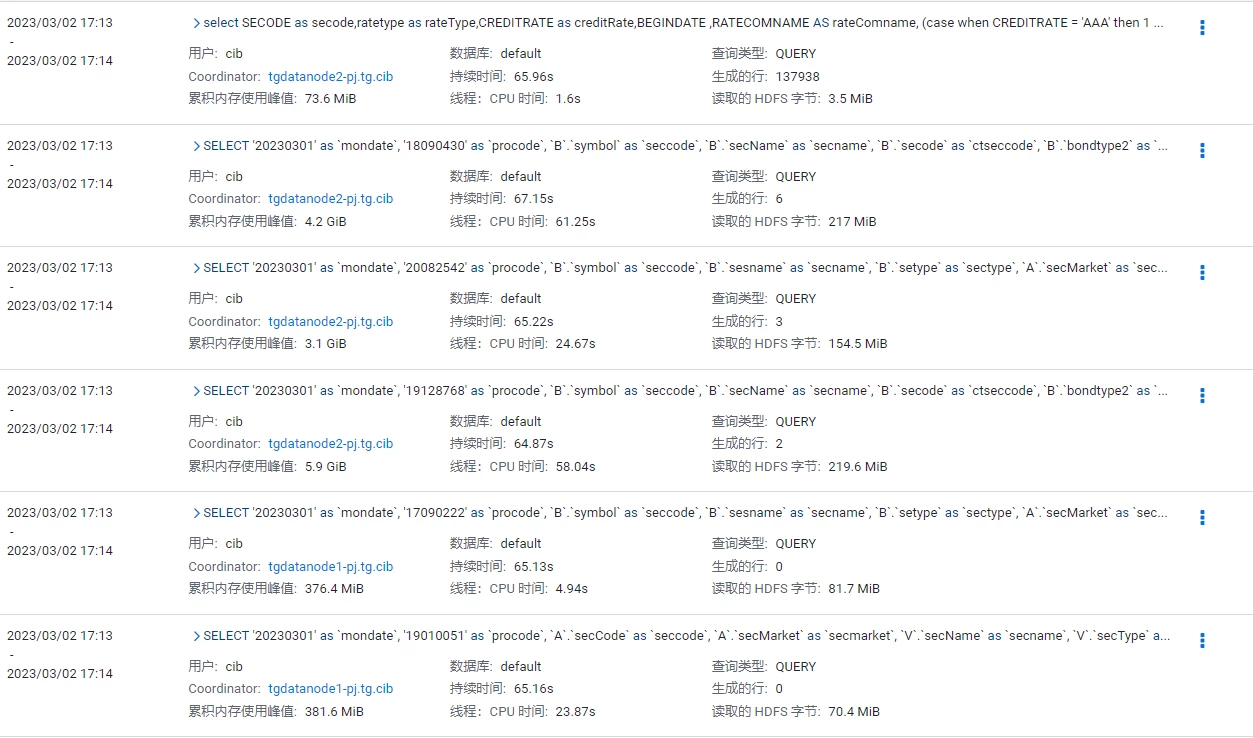
Hi @KaimingGu , the translation might have been incorrect, so I assume you're actually facing "Client Fetch Wait Time" taking the most of the time. At the same time the "Client Fetch Wait Time Percentage" is also close to 100%.
This means that while the query has been executed quicky, the client was too slow to fetch the results. This is usually a sign that the network may be slow or the client is facing other slowness, for example it does some processing between the "result.next()" calls, or hitting GC pauses (if it's a Java application).
See also the following blog post which explains the different query profile metrics:
https://www.ericlin.me/2020/02/impala-query-profile-explained-part-5-query-metrics/
Best regards
Miklos Szurap
Customer Operations Engineer, Cloudera


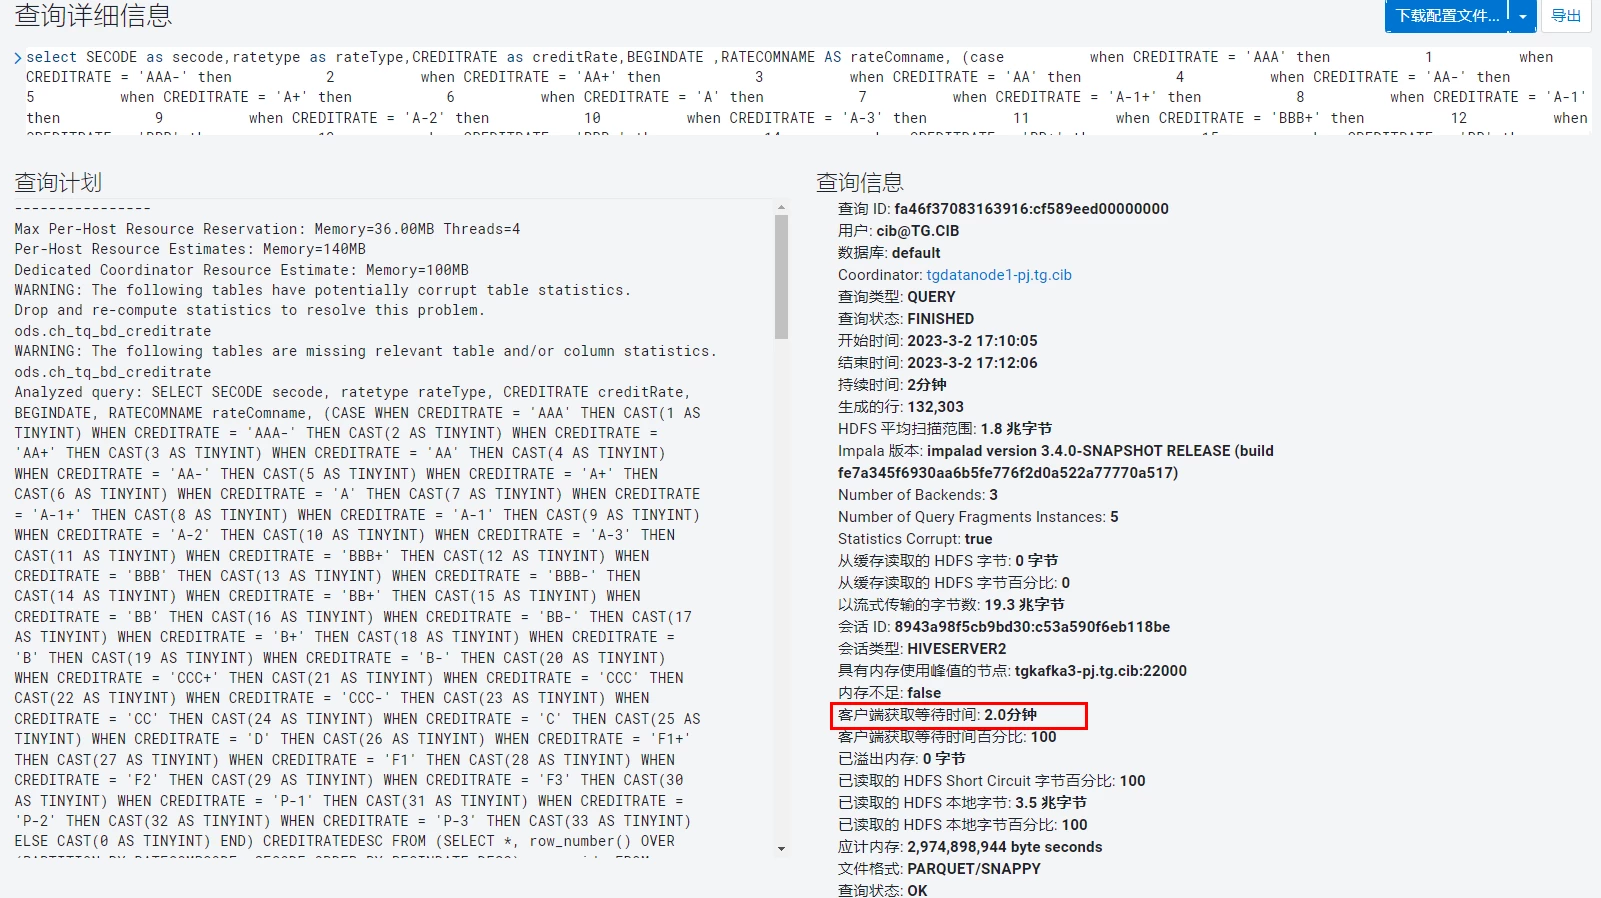 查询慢的脚本1
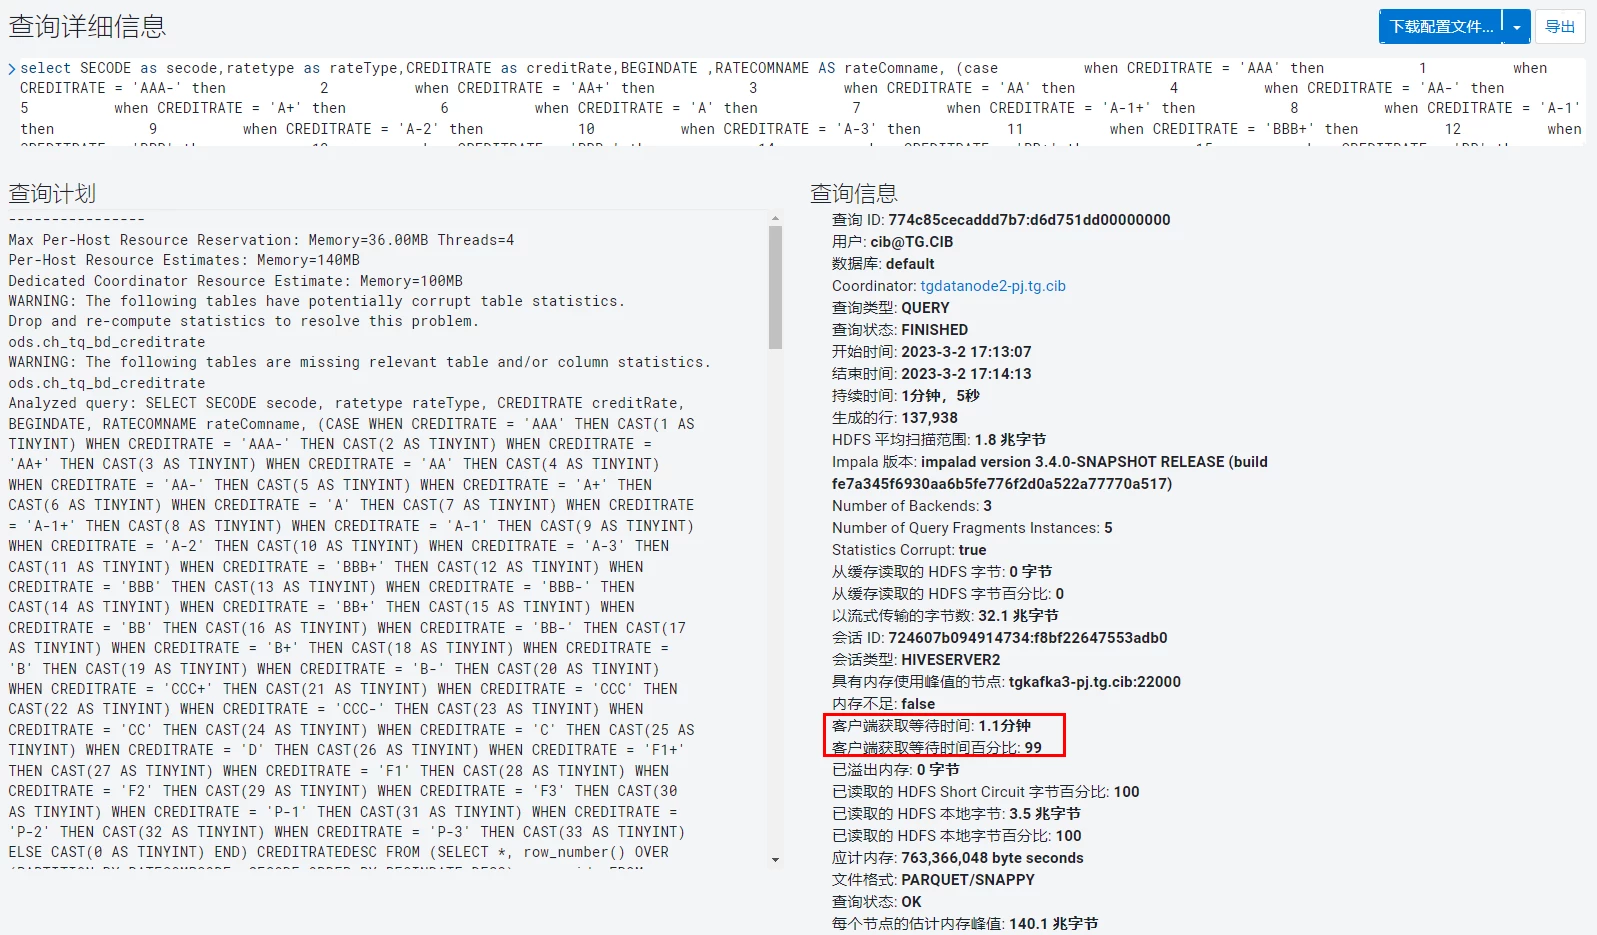 查询慢的脚本2
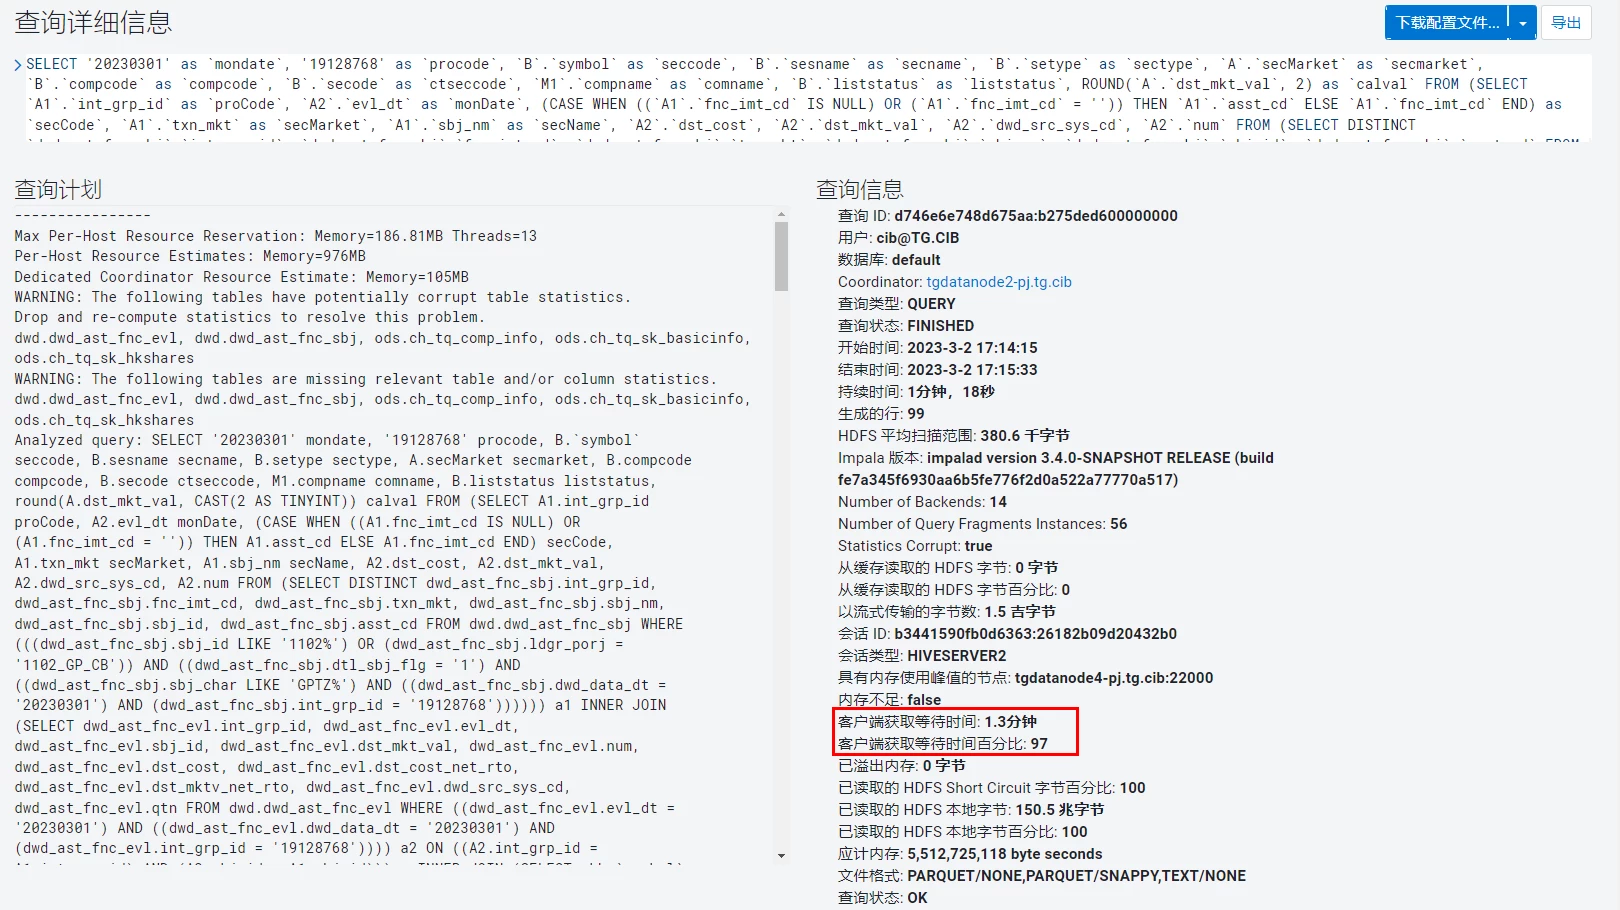 查询慢的脚本3