


New Visualization Feature in Hive View
There are new Data Visualization, Data Explorer tabs that come part of Hive view which are really nice. I found this by accident so thought there may be others who are probably not aware of this either.
Environment details: Should work in vanilla cluster/sandbox as well but in my case the env is as below (setup using steps here😞
- Kerborized HDP 2.3.2 w/ Ranger installed
- Secure Ambari 2.1.2 (authenticating to users in IPA LDAP)
- The sample salary data from sandbox has also been imported and was used for visualization
1. After logging to Ambari 2.1.2, open the Hive view (in this case I had to create a new instance of the view configured for kerberos).
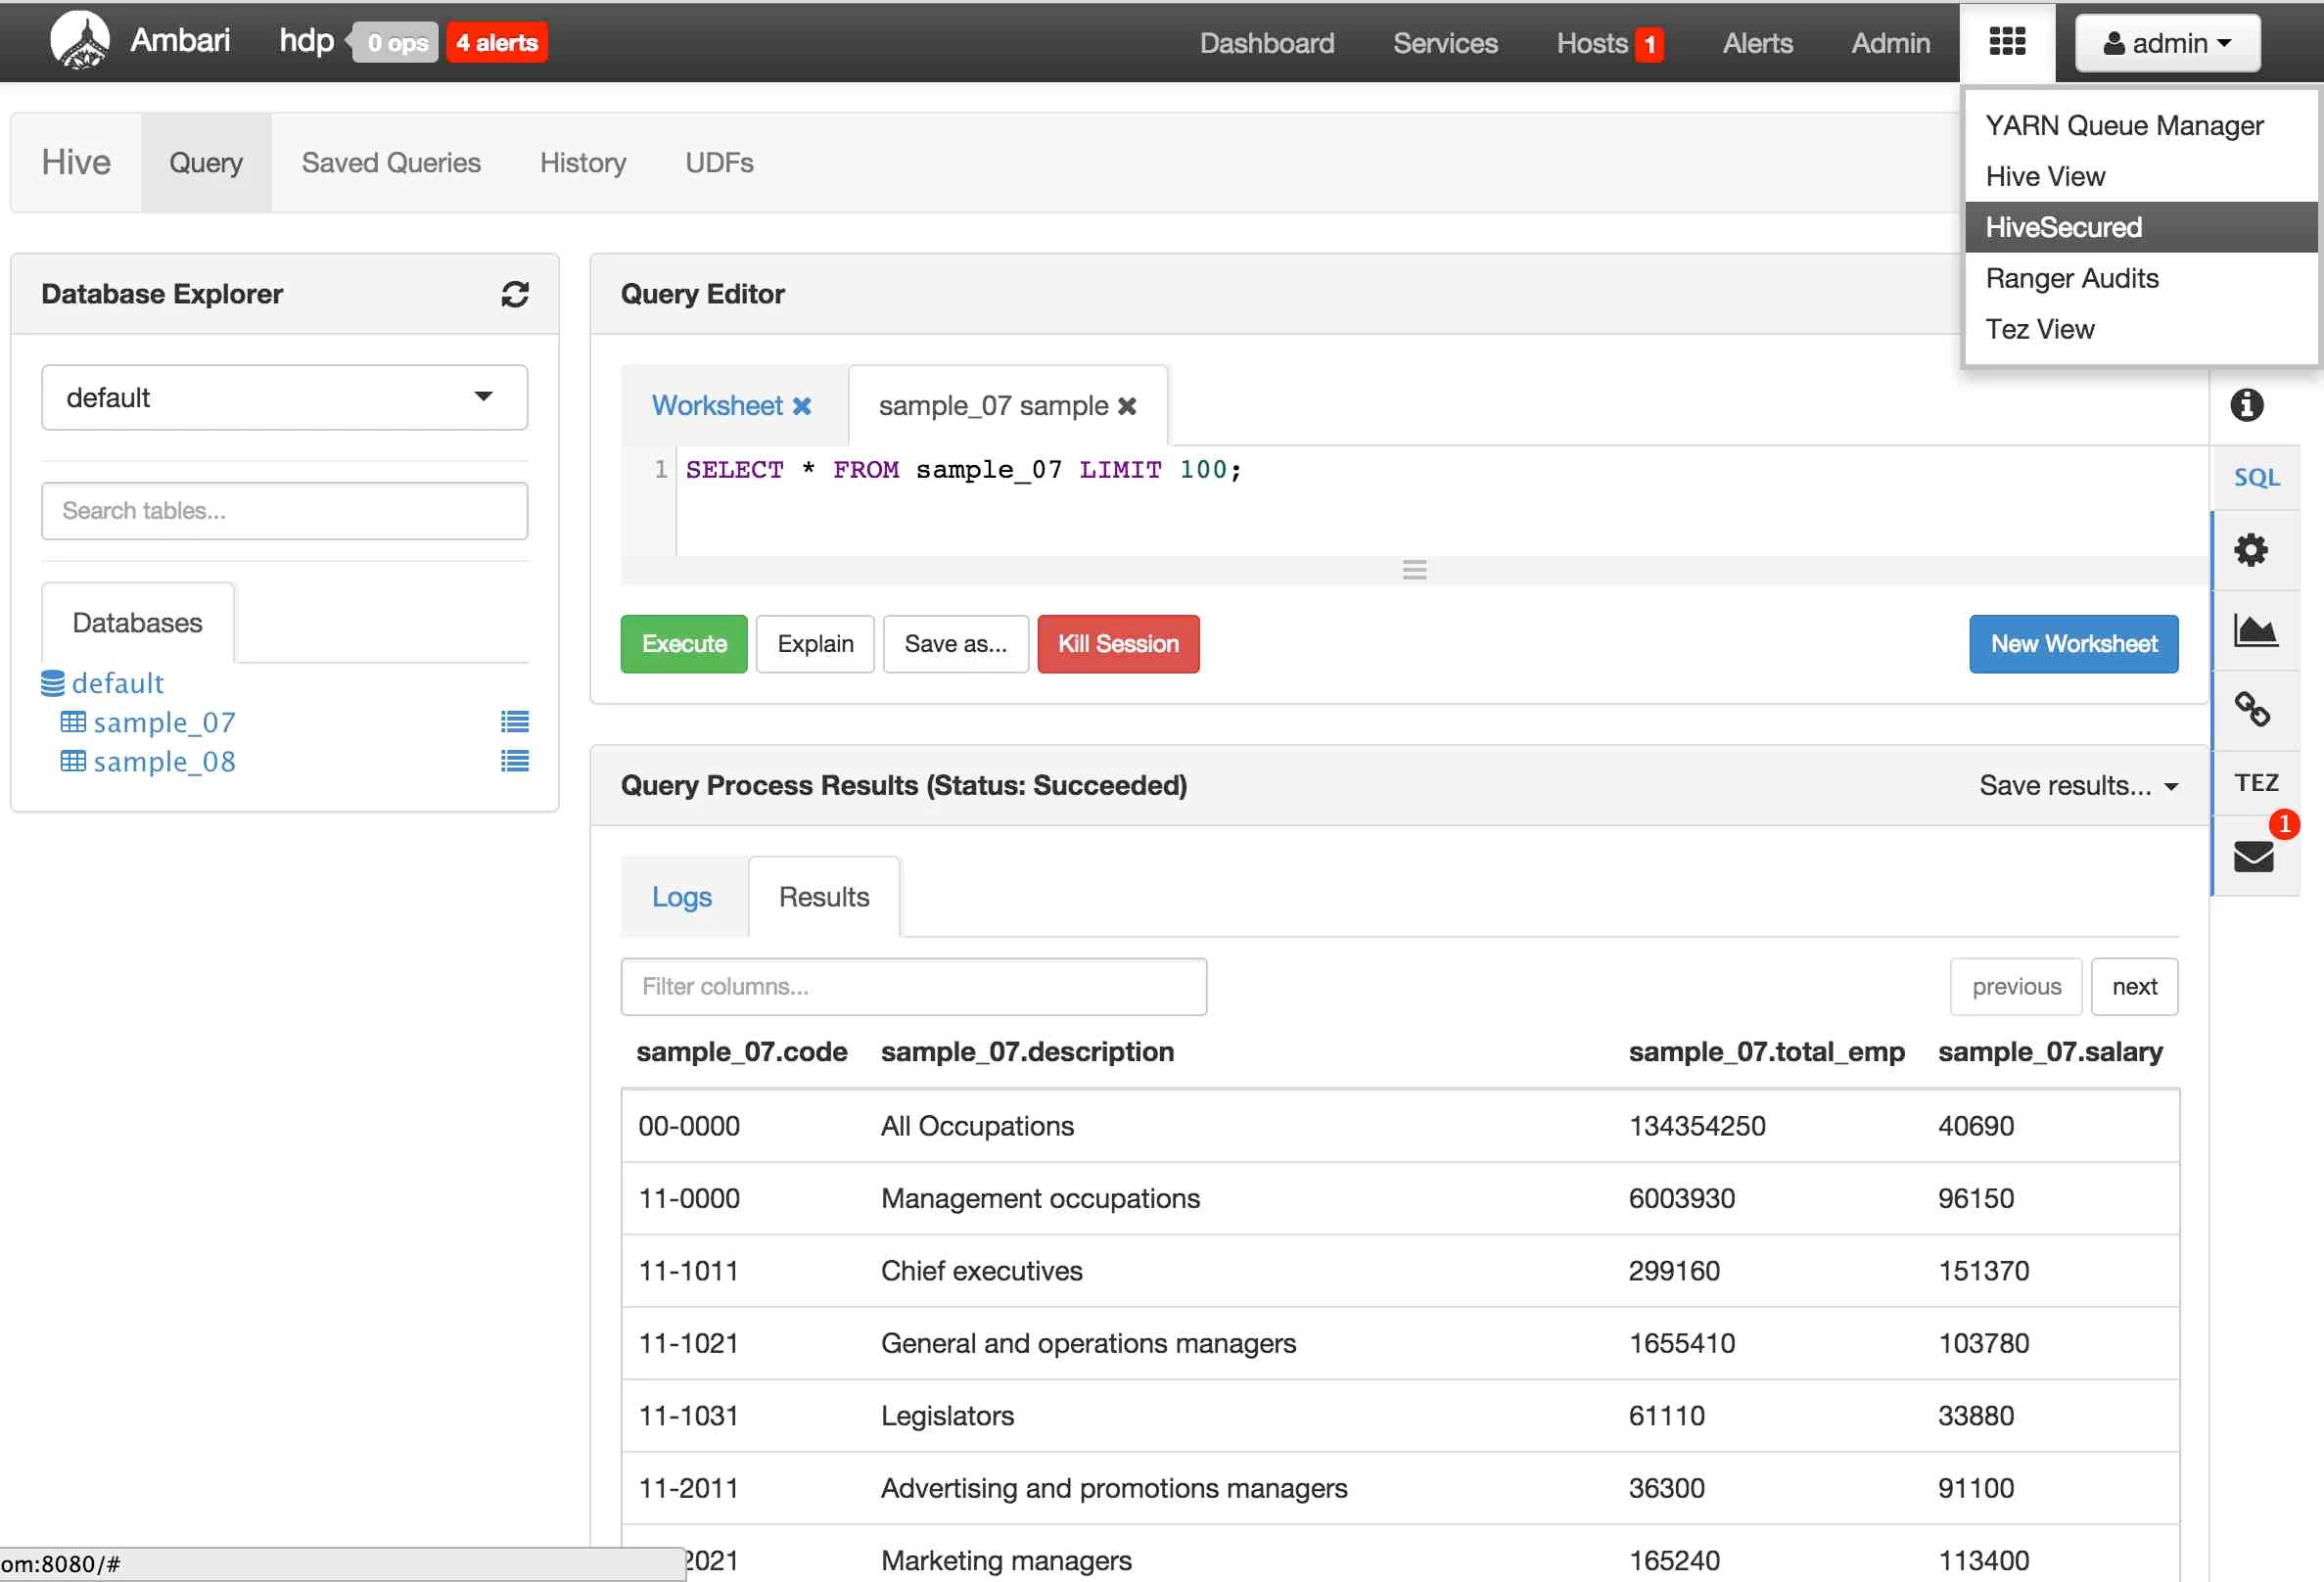
2. Click the Data Visualization tab on the right and drag/drop description and salary fields onto x, y fields
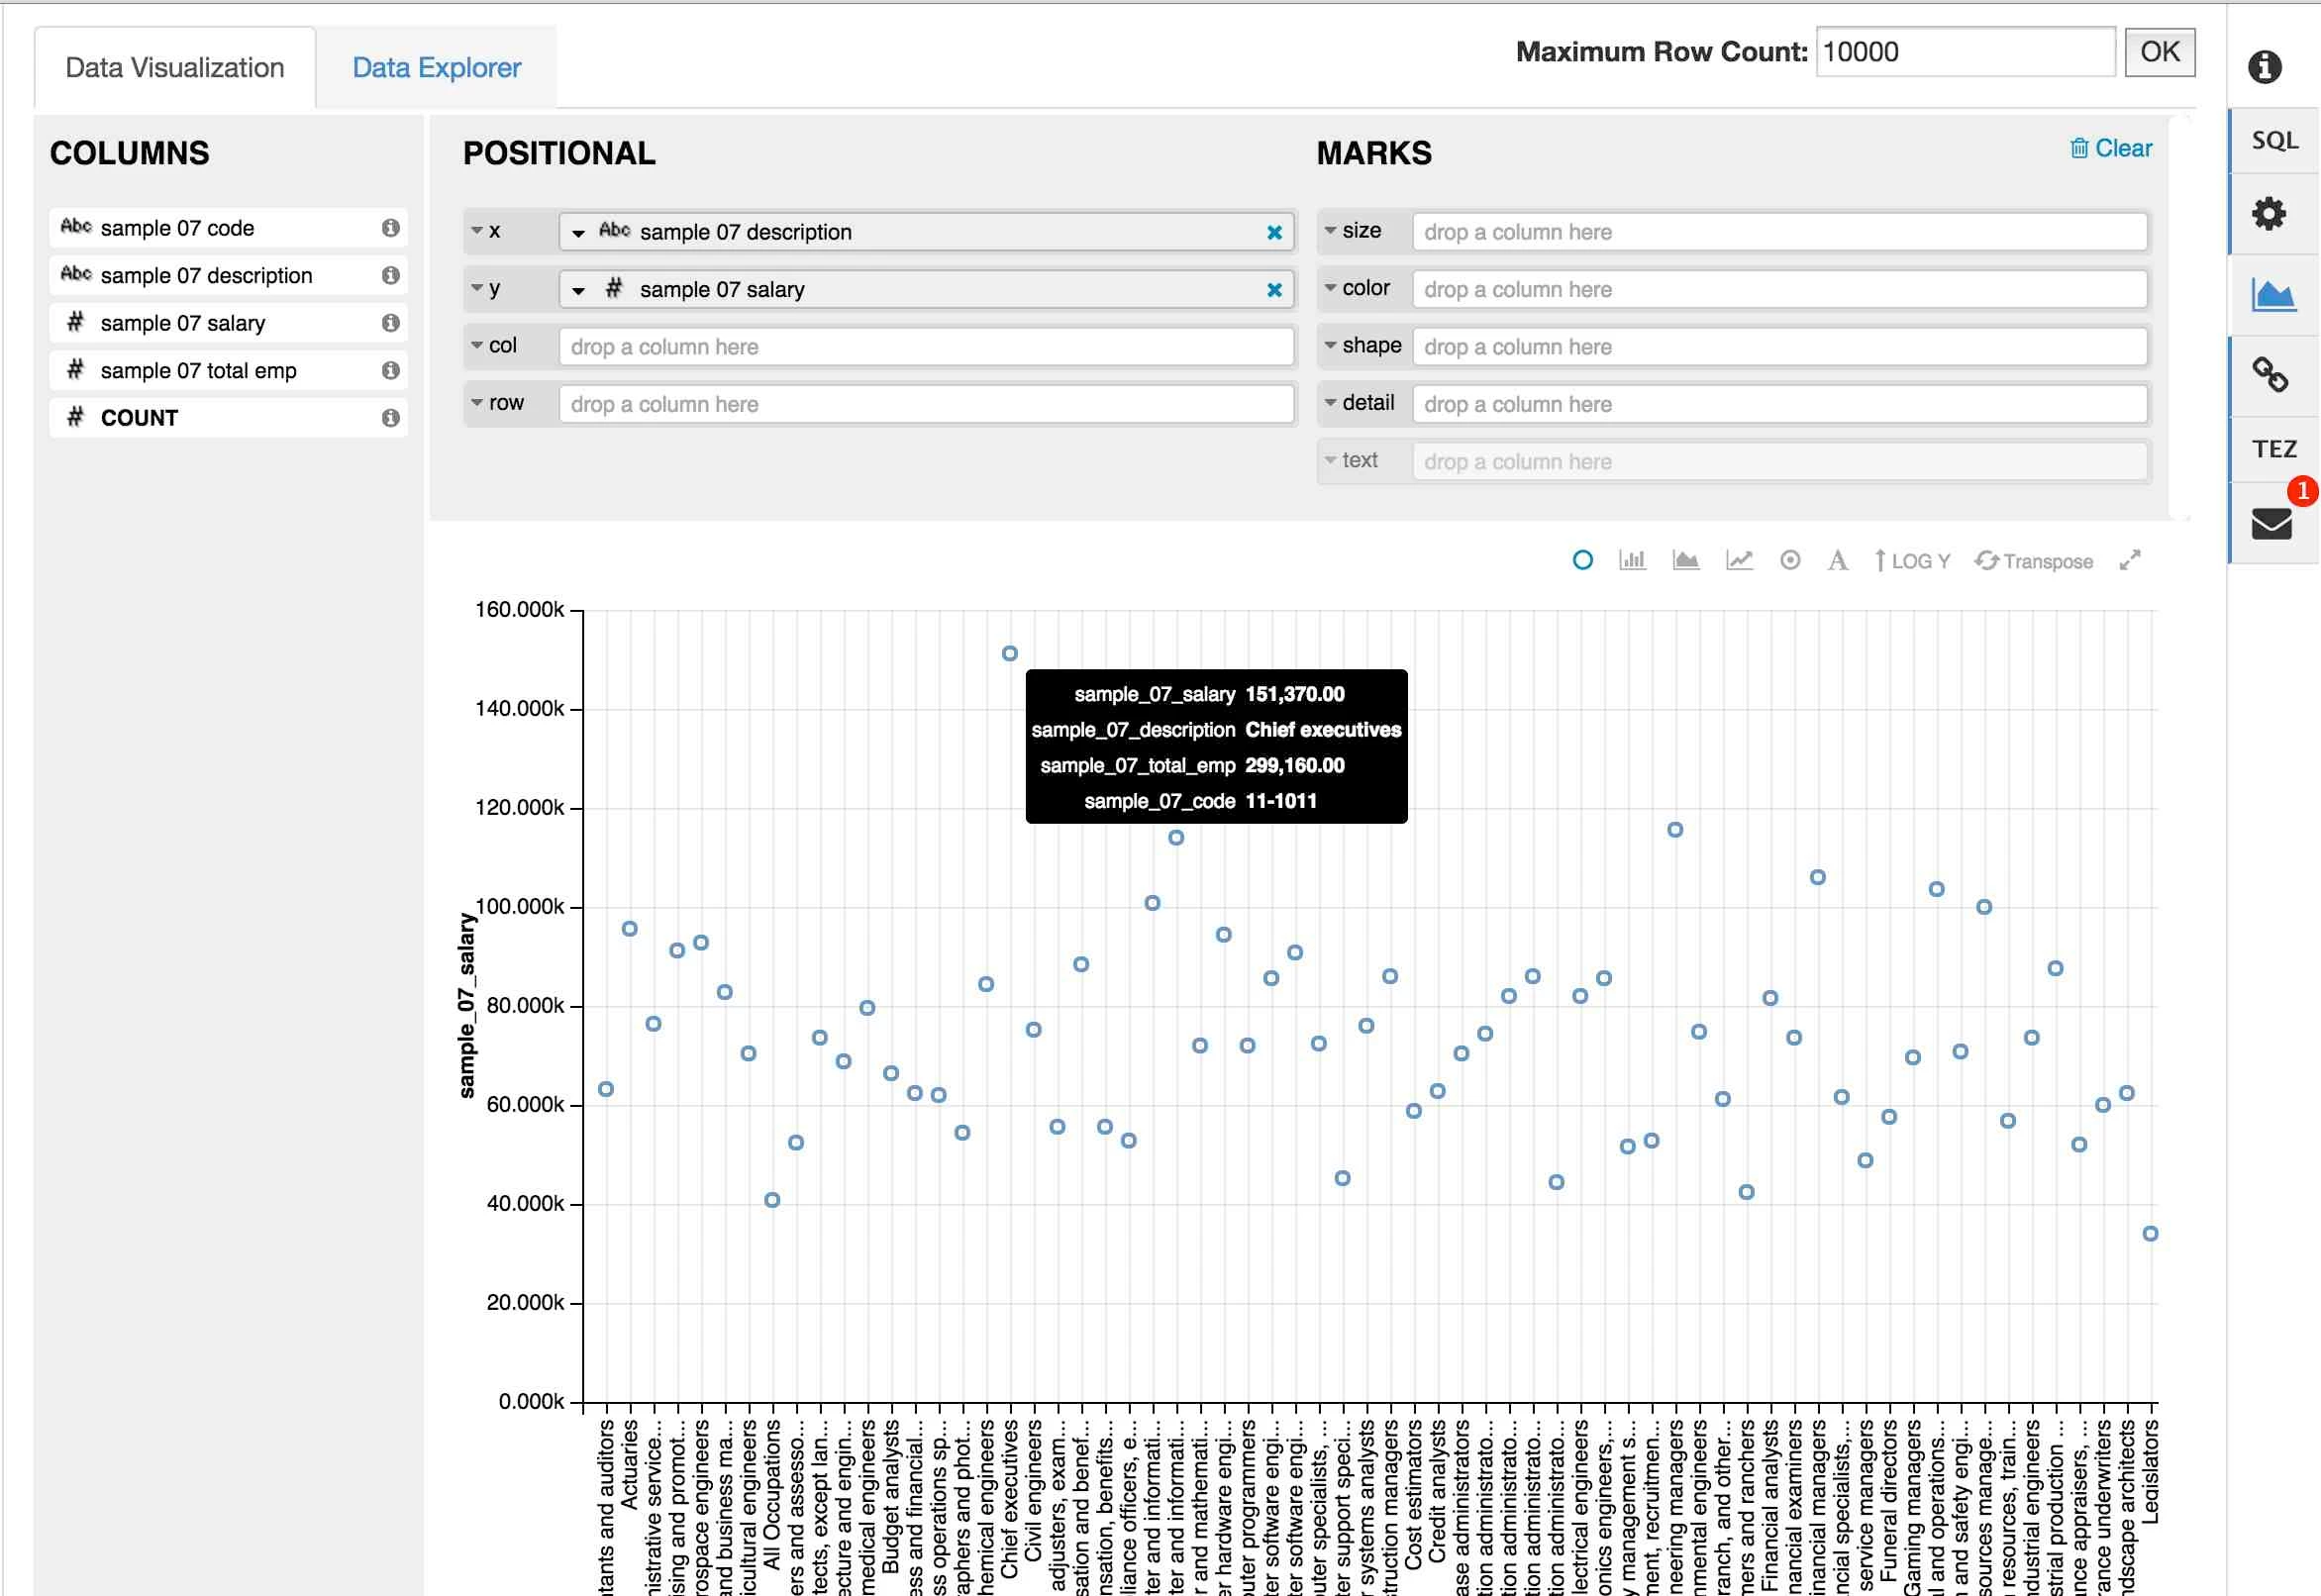
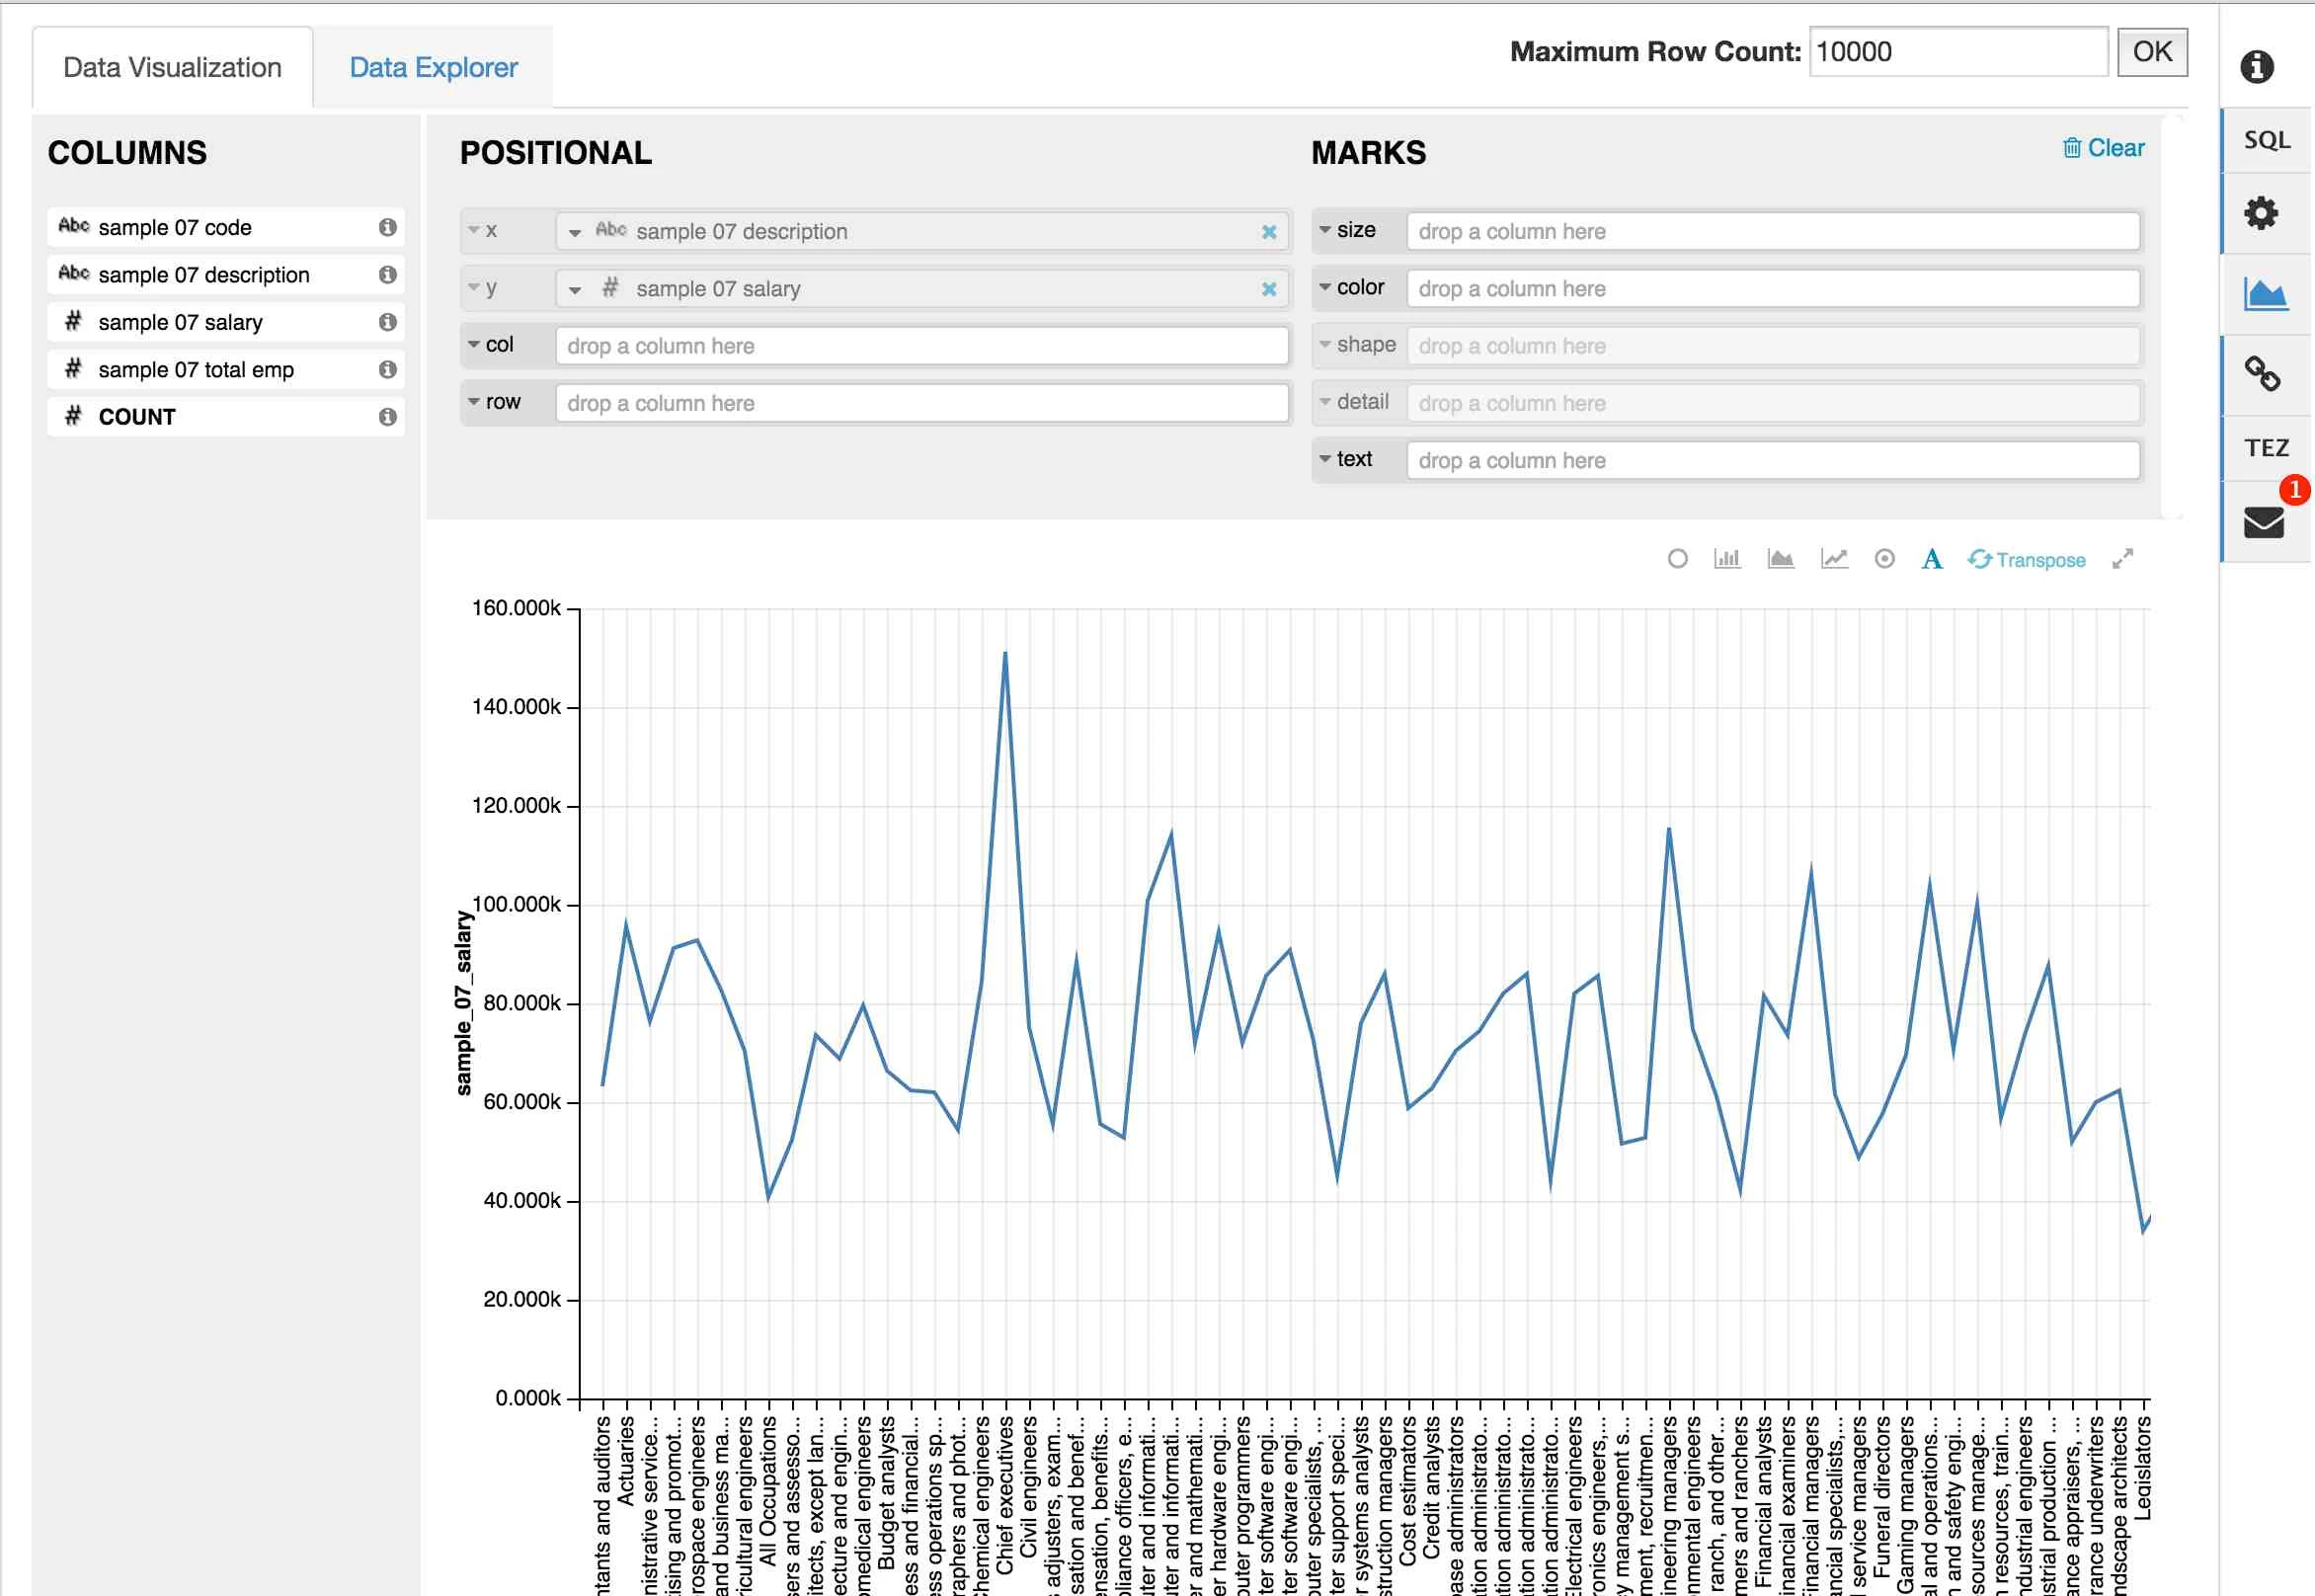
3. Select from the various chart options to change the chart
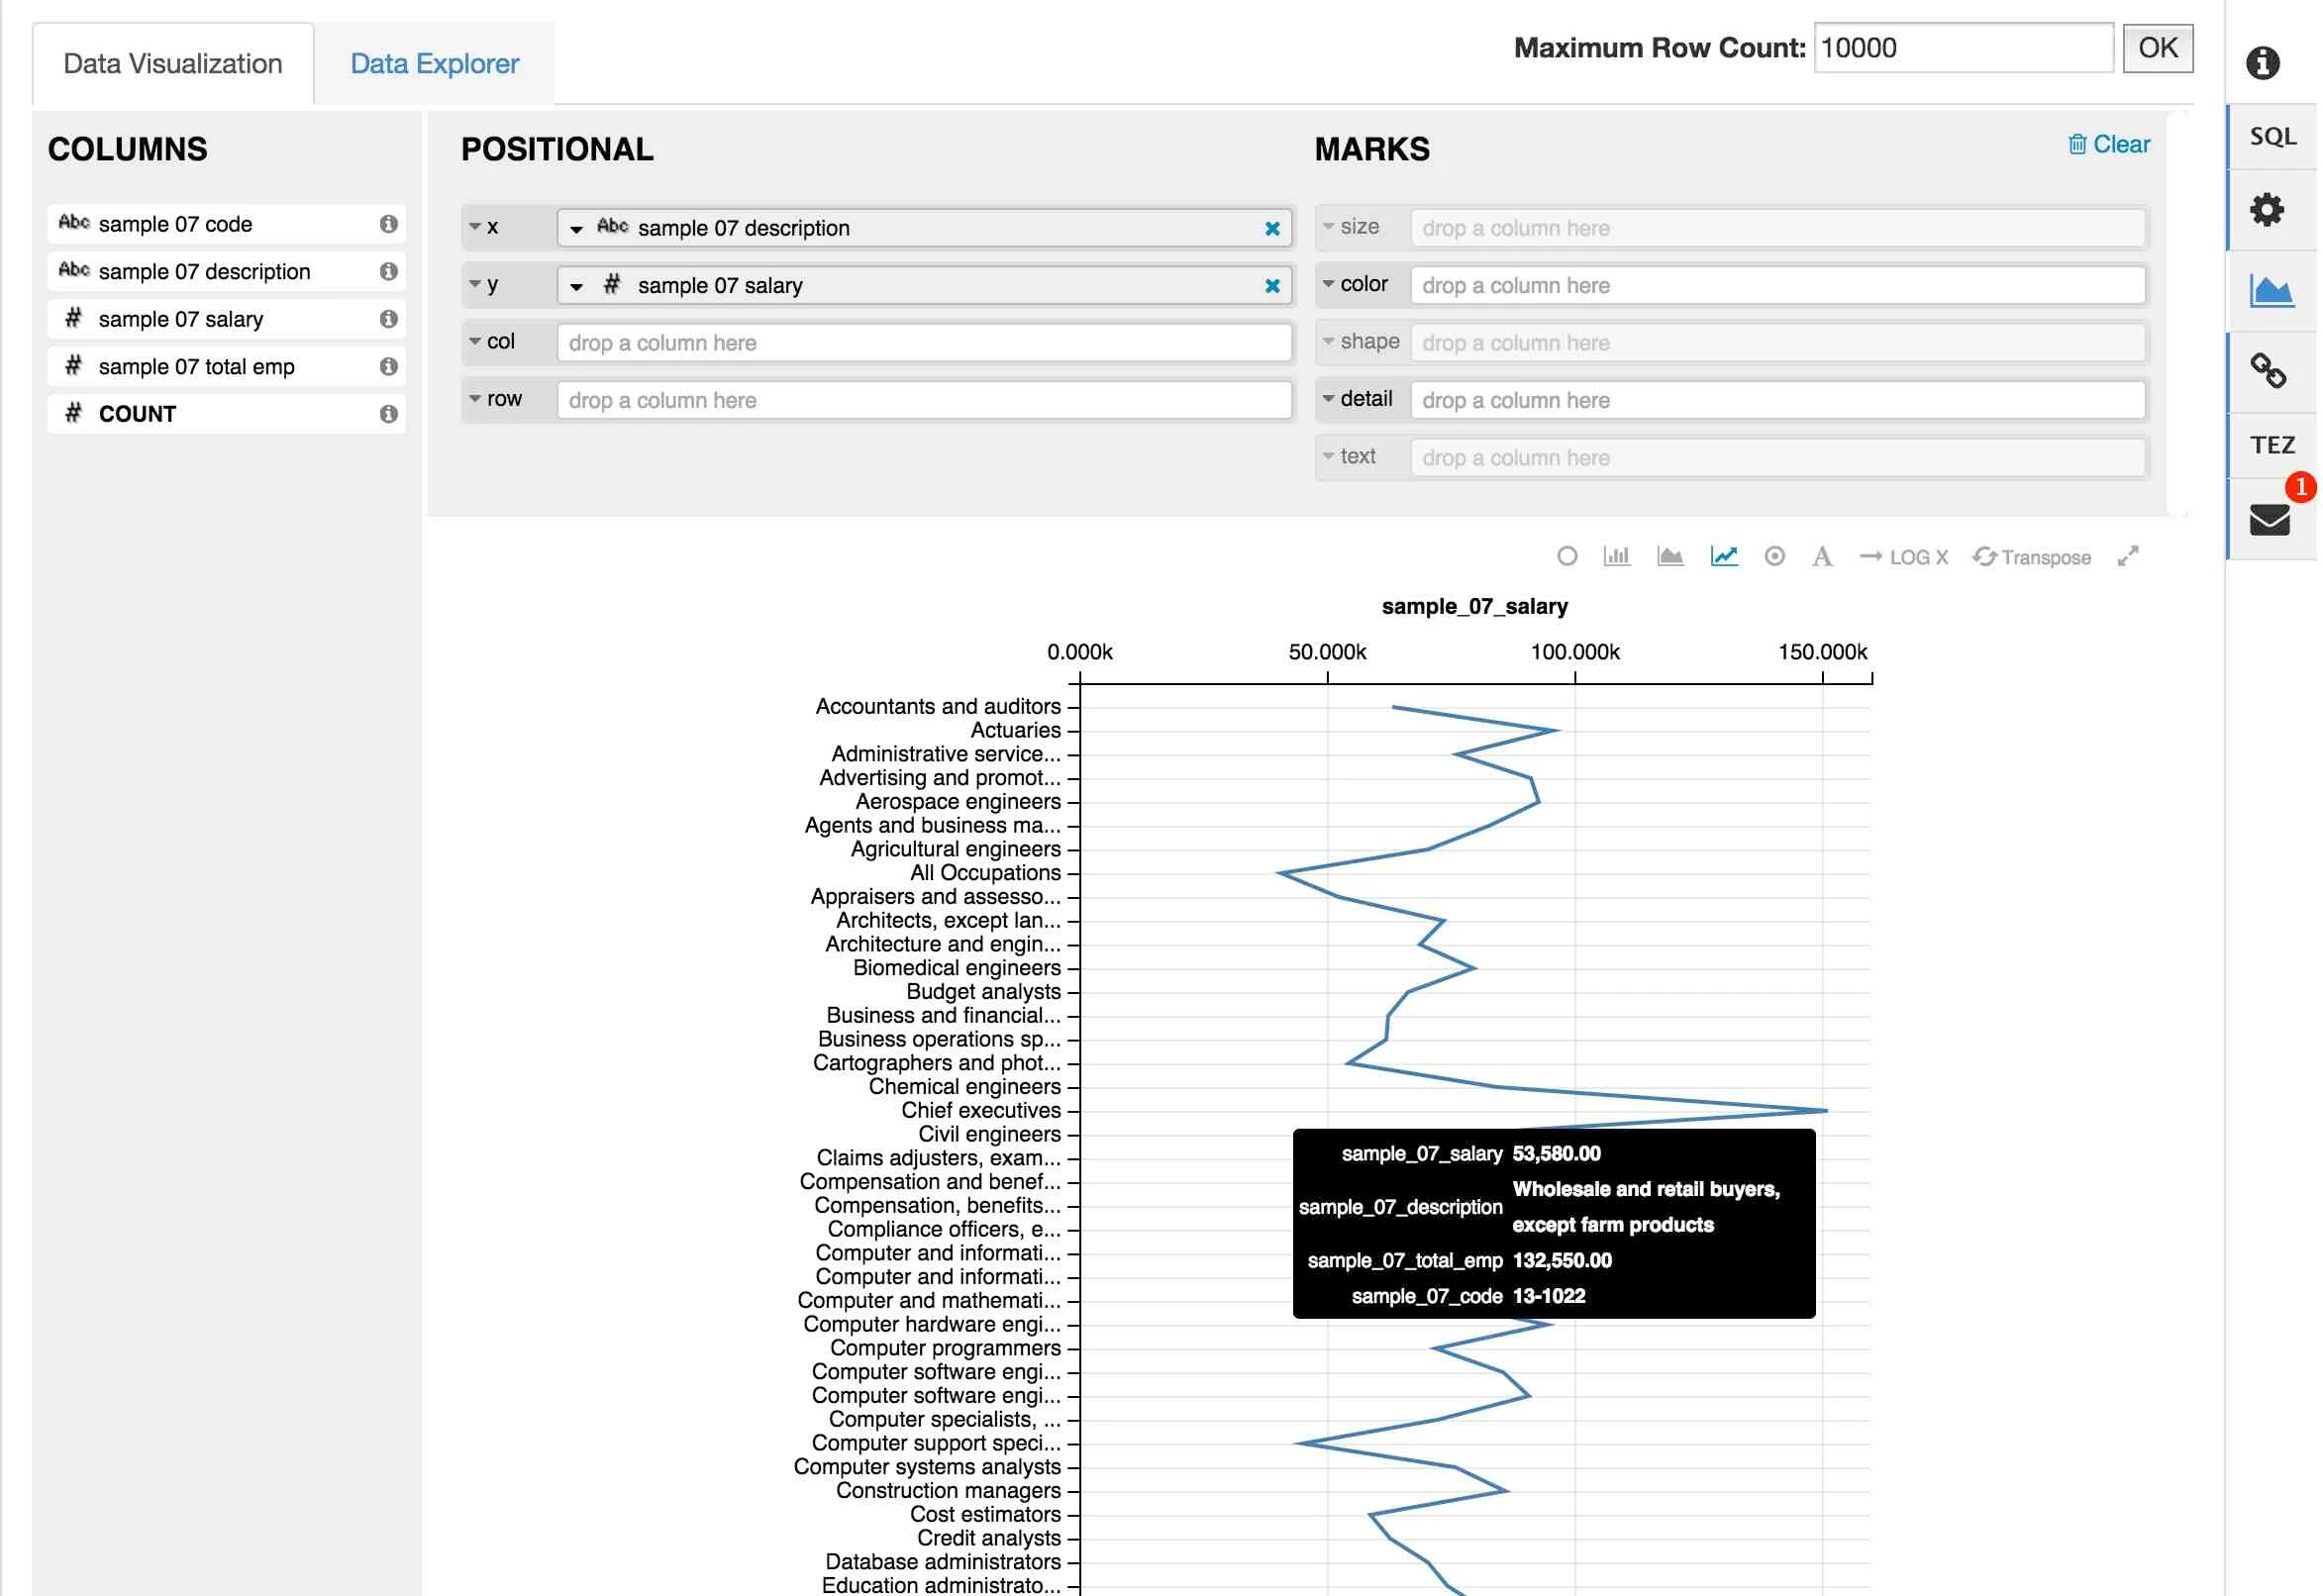
4. Click transpose button:
5. Navigate to Data Explorer tab to explore your data using the different fields
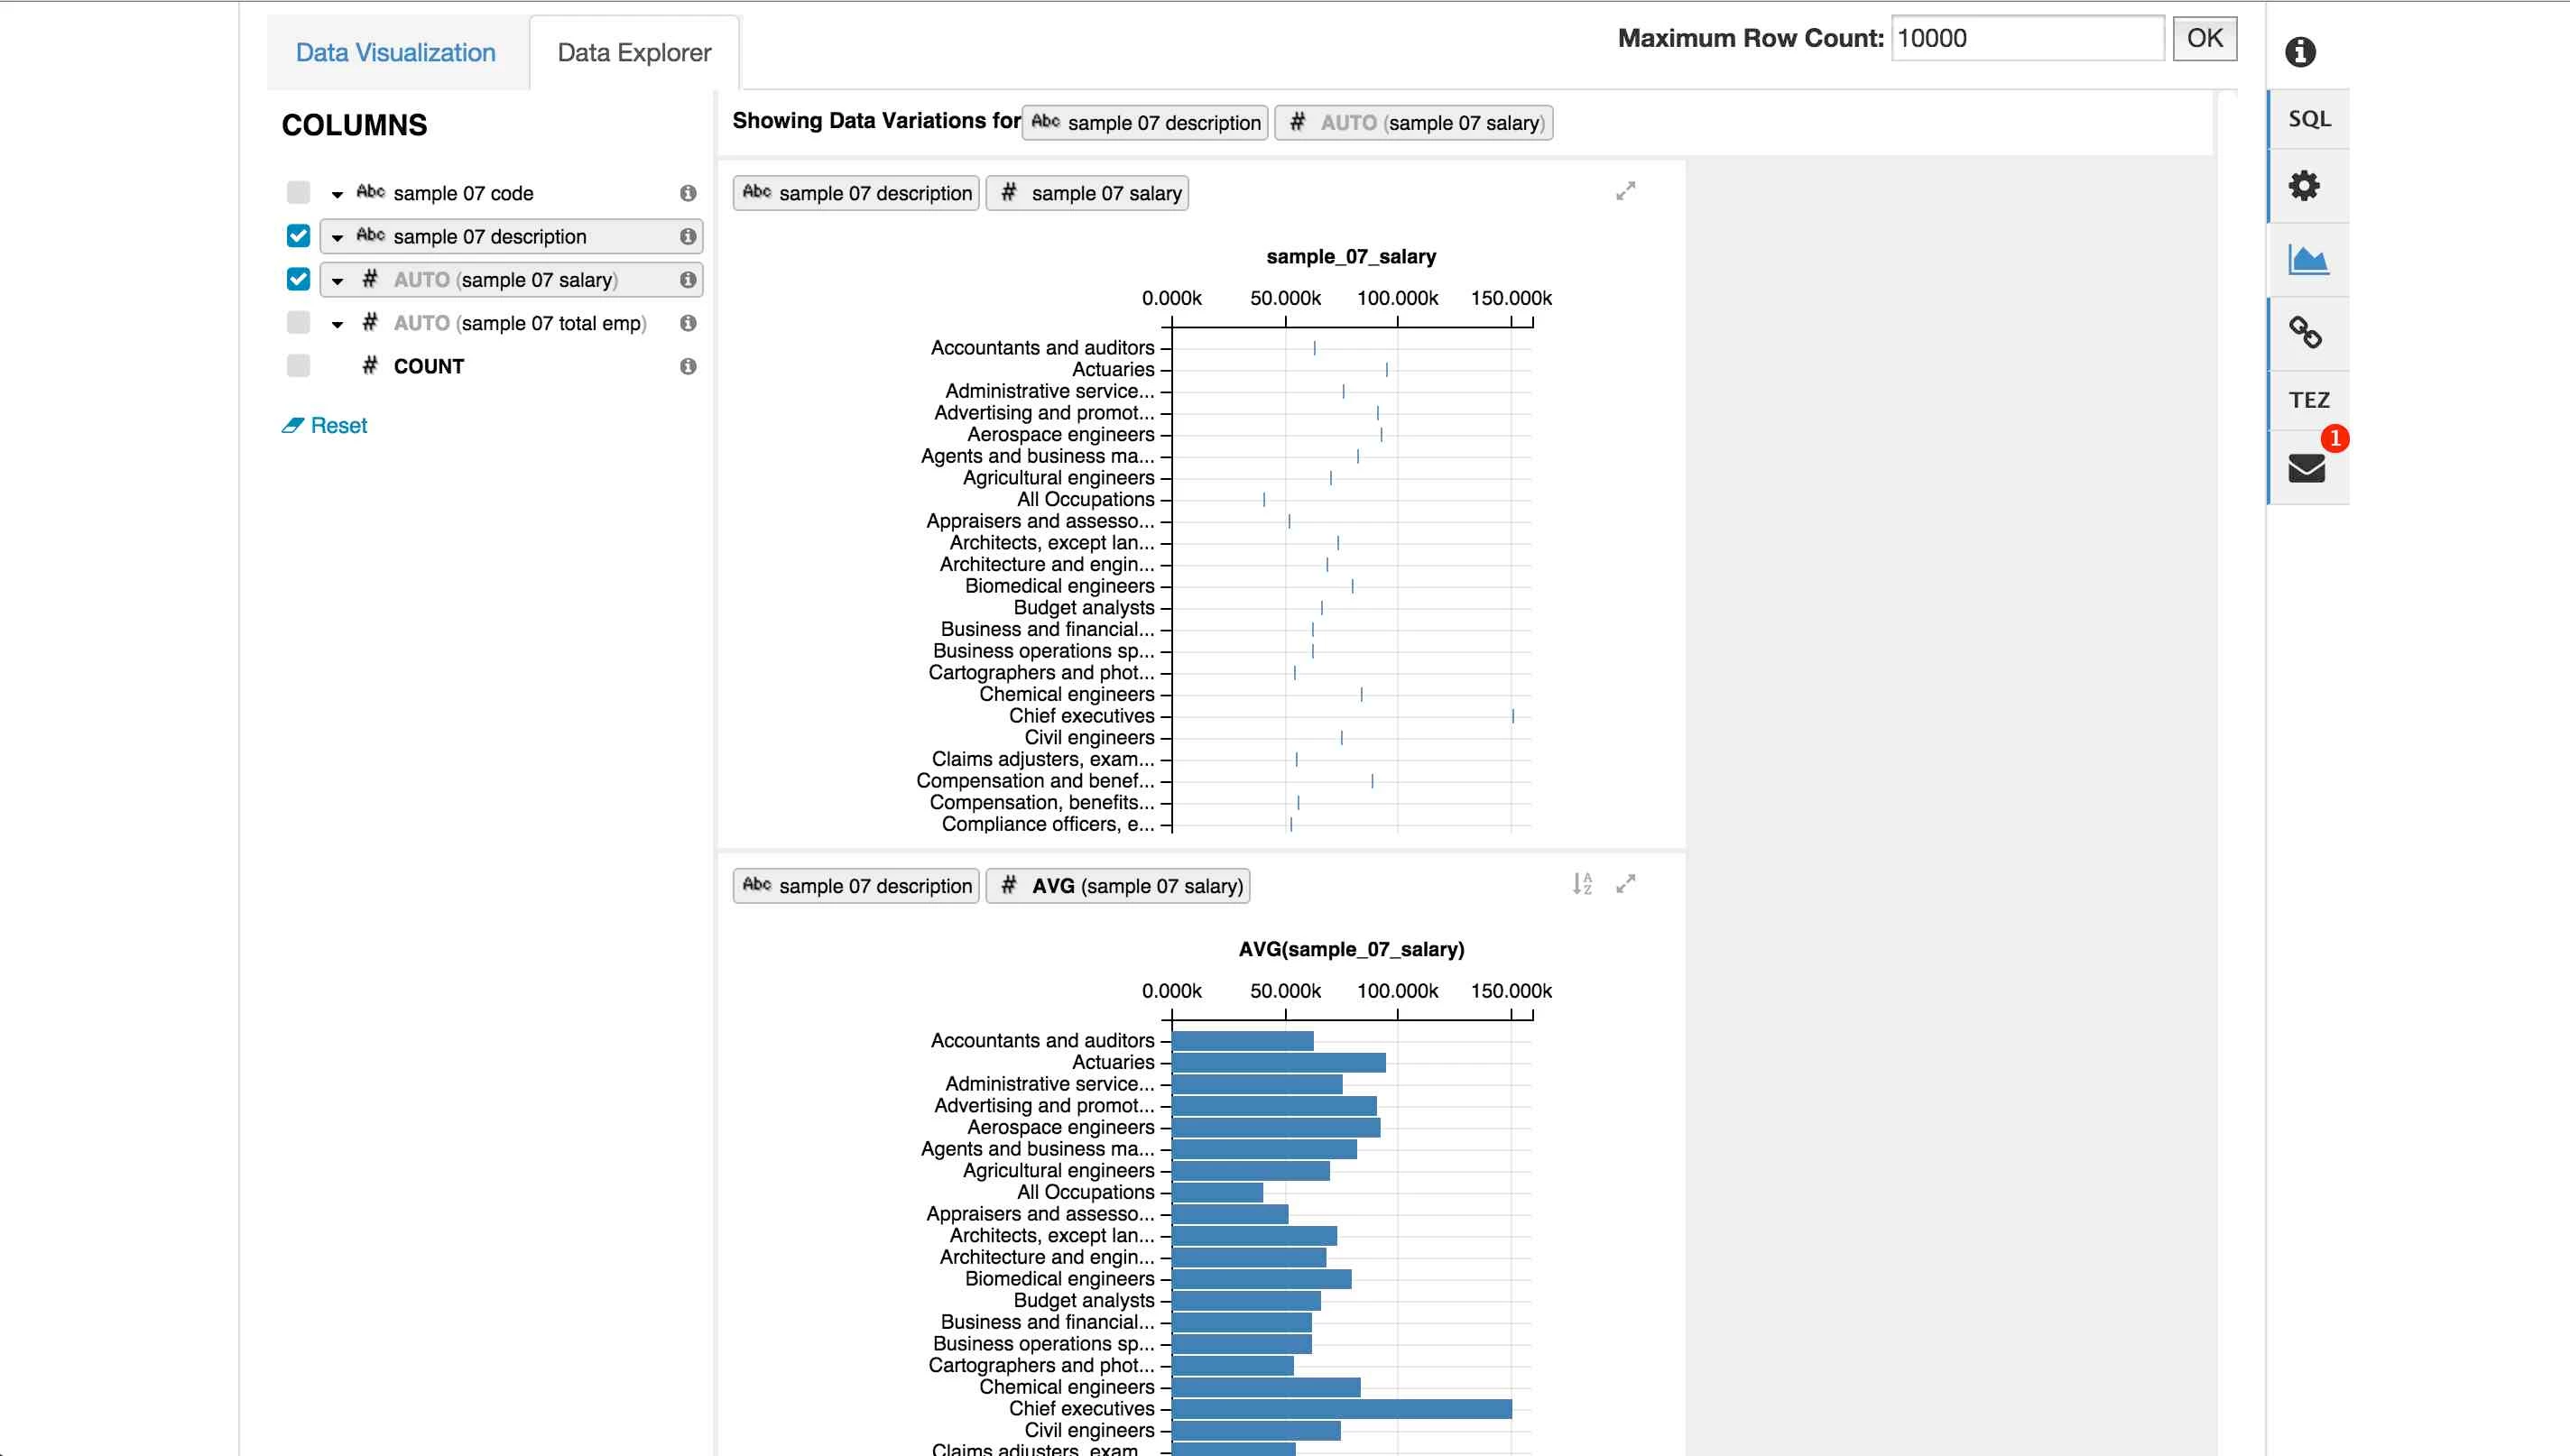
So all in all: visualizations look good, are responsive (at least on this dataset), and seem to work without issue on kerborized cluster!