
Use Grafana with Ambari as a Data Source
Grafana is a popular, open-source graph and dashboard builder ( licensed under Apache License, Version 2.0).
Grafana is feature rich; not only does it let users create customizable and shareable dashboards, it also offers templated/scripted dashboards, LDAP integration, multiple data sources, and more.
Out of the box, Grafana supports data sources such as Graphite, OpenTSDB, ElasticSearch, InfluxDB, CloudWatch, and etc.
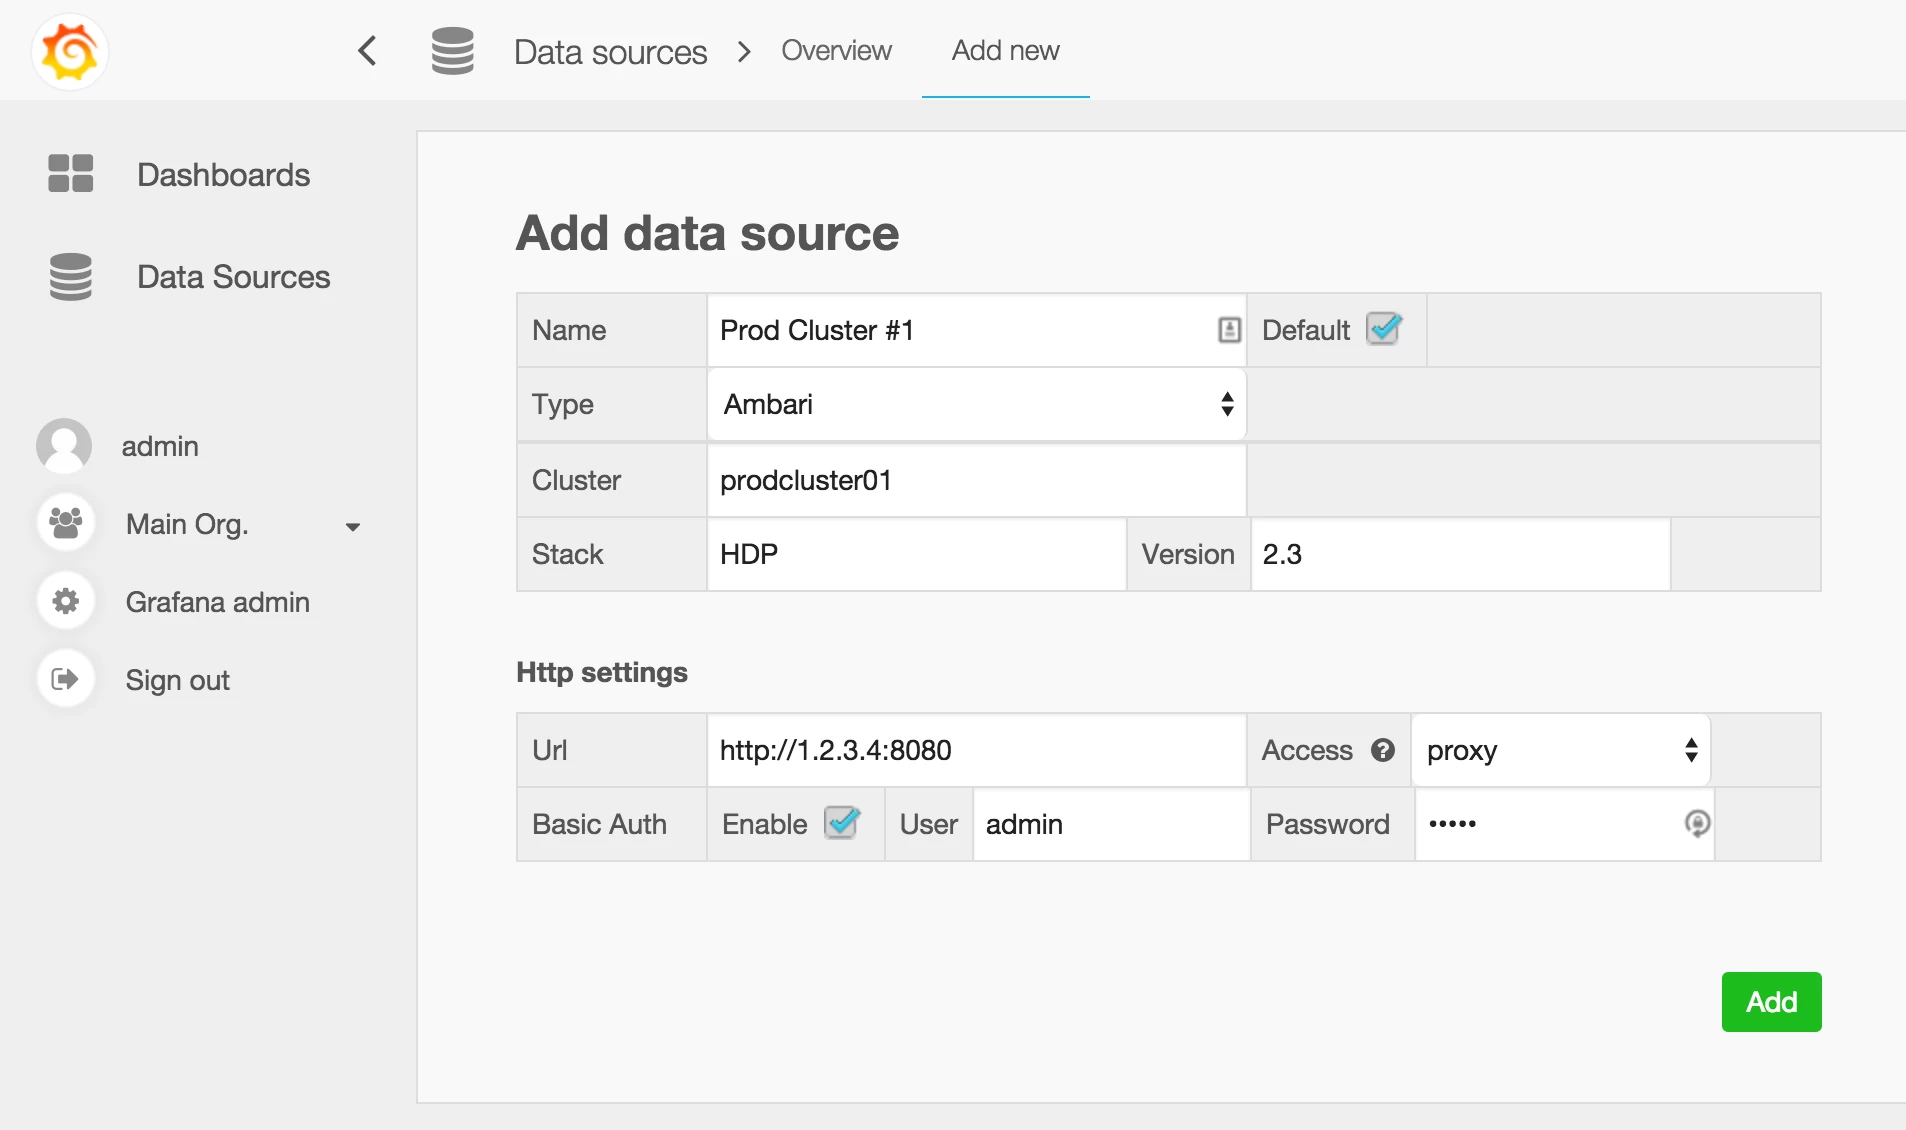
Luckily, the data source part is pluggable; it was not too difficult to create an Ambari data source for it: https://github.com/u39kun/ambari-grafana
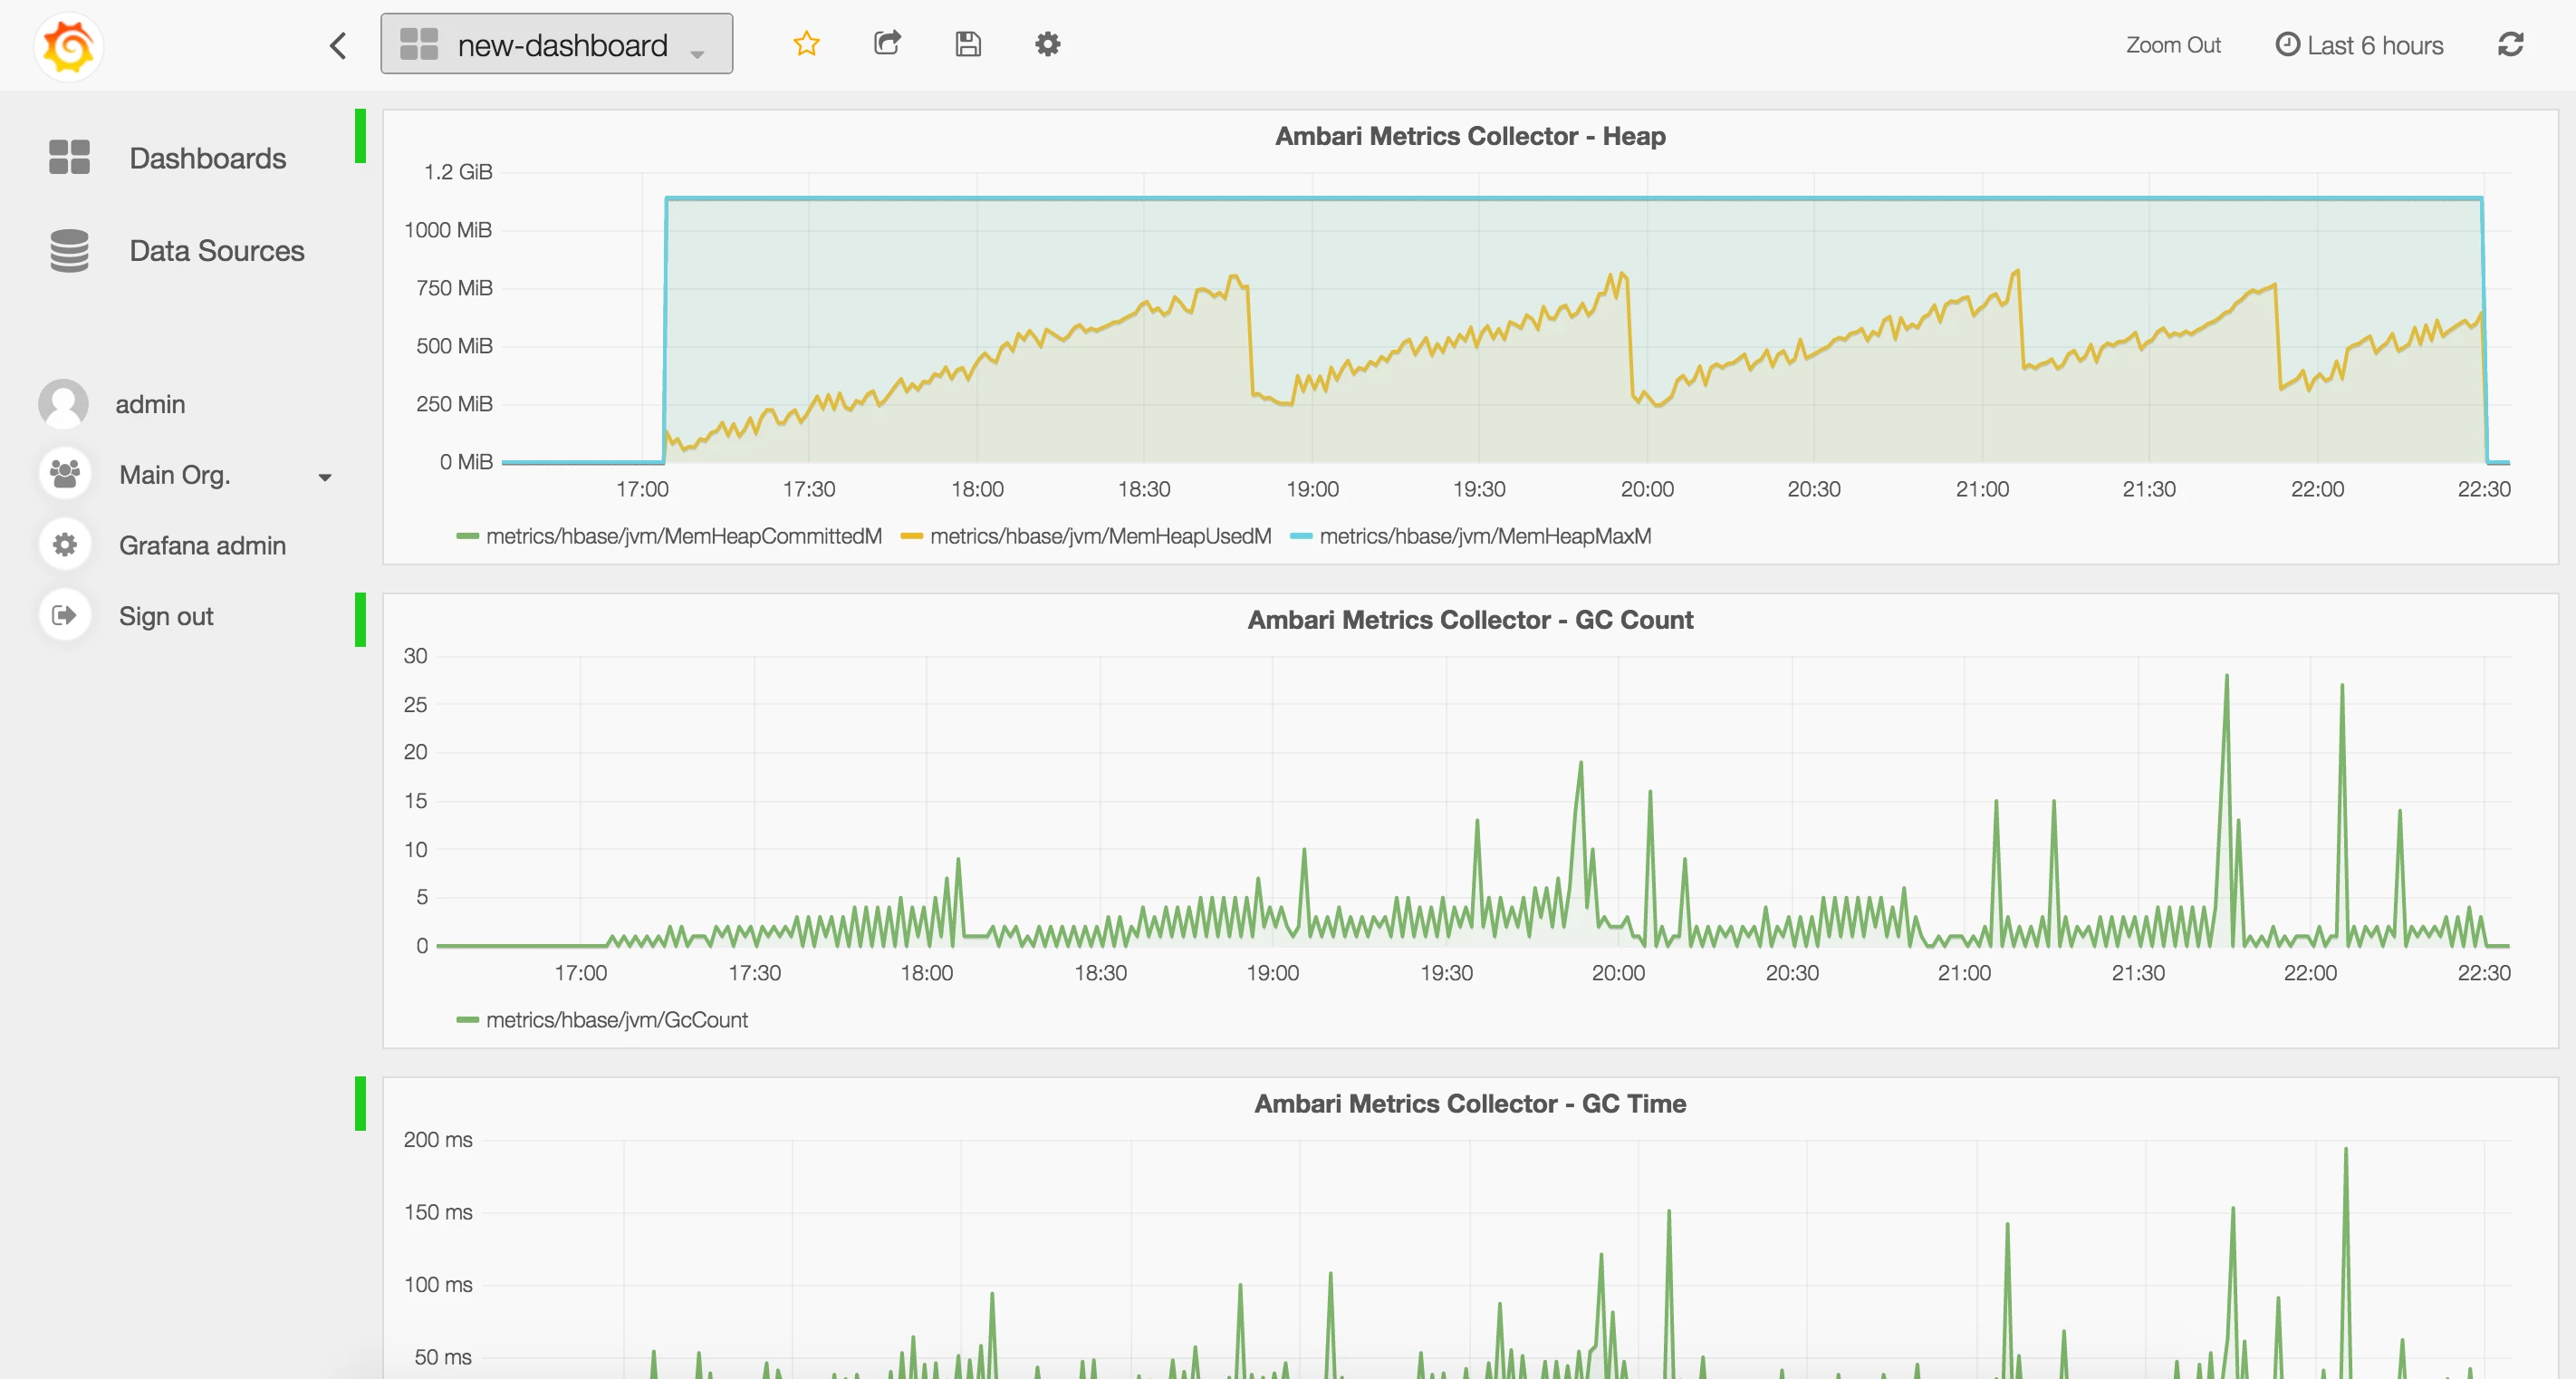
It works for all service metrics currently exposed via Ambari: HDFS, YARN, HBase, Storm, Kafka, Flume, Accumulo, and Ambari Metrics.
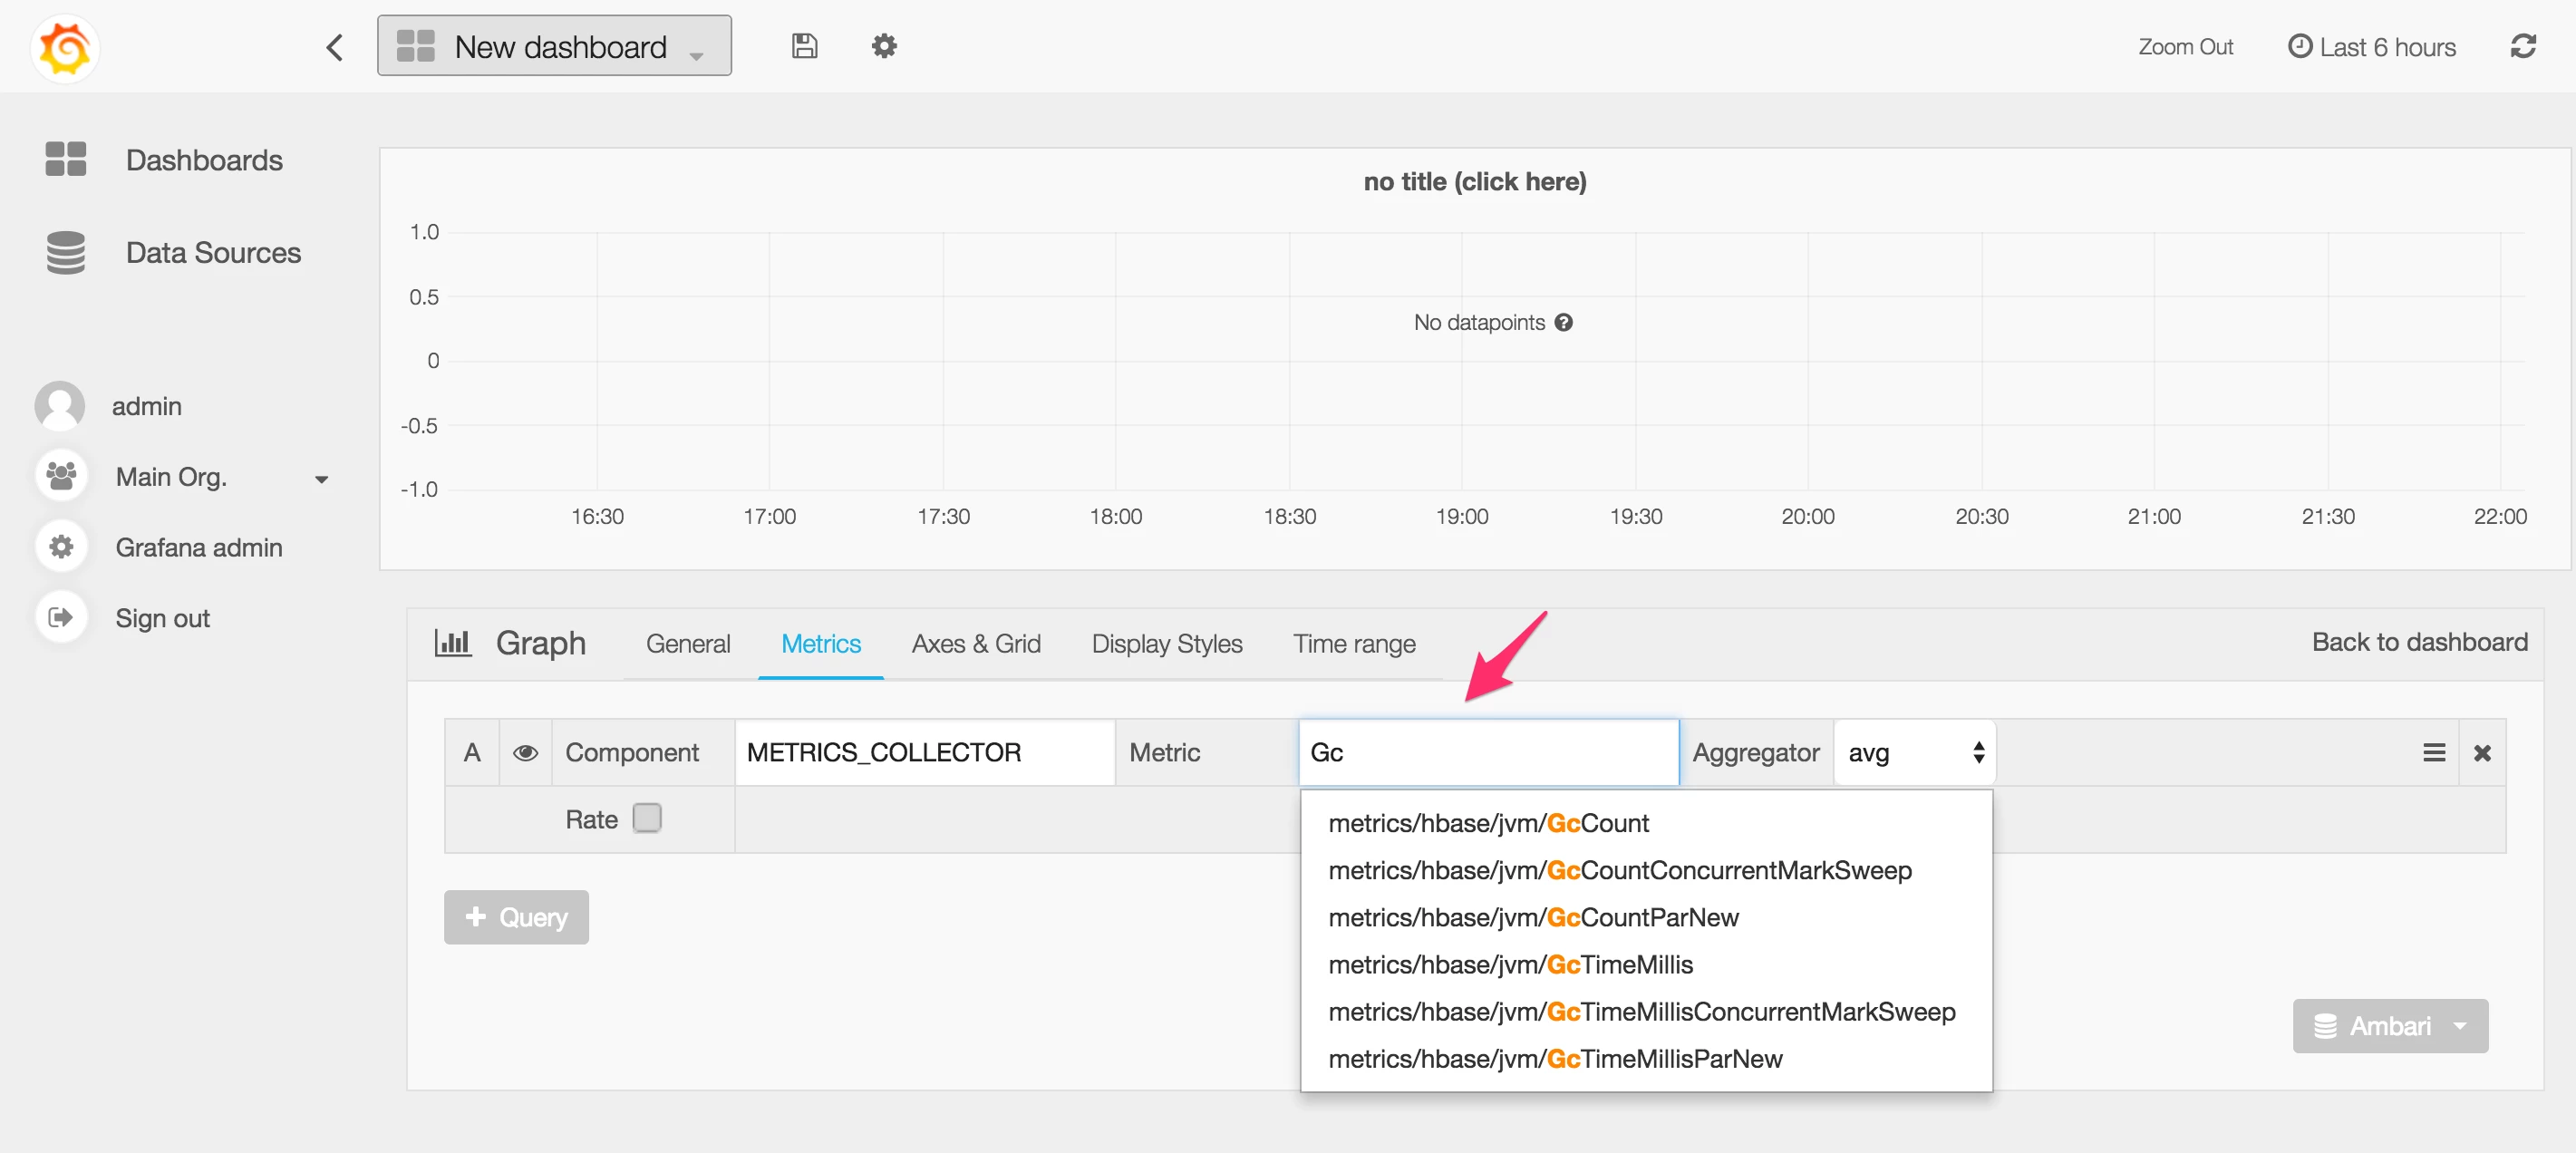
It supports typeahead of component names and their associated metrics, as well as aggregation (“avg”, “sum”, “min”, and “max” of metrics across all instances of the specified component).
Host Metrics are not supported yet, but it shouldn't be too difficult to add.
Please visit https://github.com/u39kun/ambari-grafana/blob/master/README.md for detailed and easy-to-follow instructions on how to install and use Grafana with Ambari as a data source.
Note: Development of the Ambari data source in Grafana was done against Ambari 2.1.2 + HDP 2.3.