Cloudera Data Analytics (CDA) Articles
- Cloudera Community
- Groups
- Cloudera Data Analytics (CDA)
- Community Articles
- Deploy your Cloudera Manager Dashboards - Complete...
- Subscribe to RSS Feed
- Mark as New
- Mark as Read
- Bookmark
- Subscribe
- Printer Friendly Page
- Report Inappropriate Content
- Subscribe to RSS Feed
- Mark as New
- Mark as Read
- Bookmark
- Subscribe
- Printer Friendly Page
- Report Inappropriate Content
Created on
05-03-2023
12:30 AM
- edited on
05-05-2023
05:48 AM
by
VidyaSargur
Keyword Search
- Deploy Cloudera Manager Dashboards
- Free Manager Dashboards
- Cloudera Manager Troubleshooting
- Monitor CDP Cluster
- Proactively resolve Cloudera Manager alerts
- Cloudera Manager Monitoring
- JSON
- Health monitoring
- Impala health monitoring
- YARN health monitoring
- HBase tuning
- HDFS caching
- Datanode health monitoring
- HDFS NN & JN health monitoring
- Hive health monitoring
- Impala monitor coordinators
- Infra-Solr health monitoring
- Solr health monitoring
- HDFS JVM GC Sizing
- YARN JVM GC Sizing
- MGMT Cluster JVM GC Sizing
- ZK JVM GC Sizing
- Oozie JVM GC Sizing
- Hive JVM GC Sizing
Summary
Out of the box, Cloudera Manager provides plenty of valuable health checks to highlight platform and service issues that may need to be addressed along with an intuitive interface for troubleshooting issues. Nevertheless, the greater the quantity of pipelines and processes the platform supports (especially at peak loads/times), the higher the probability that you would benefit from additional visibility into overall cluster performance. To that end, we’re offering you JSON files of custom Cloudera Manager dashboards to import into your CM ’managed cluster:
Here are the links (Change this to Snapshots) to the dashboards we will preview below:
NOTE - you must change the user ID that is within each JSON file from ‘mbush’ to a suitable admin user account within your own environment, prior to uploading them in Cloudera Manager.
Three Daily Dashboards
We recommend using the following dashboards every day:
- MB - Overall Health
- MB - Impala Health
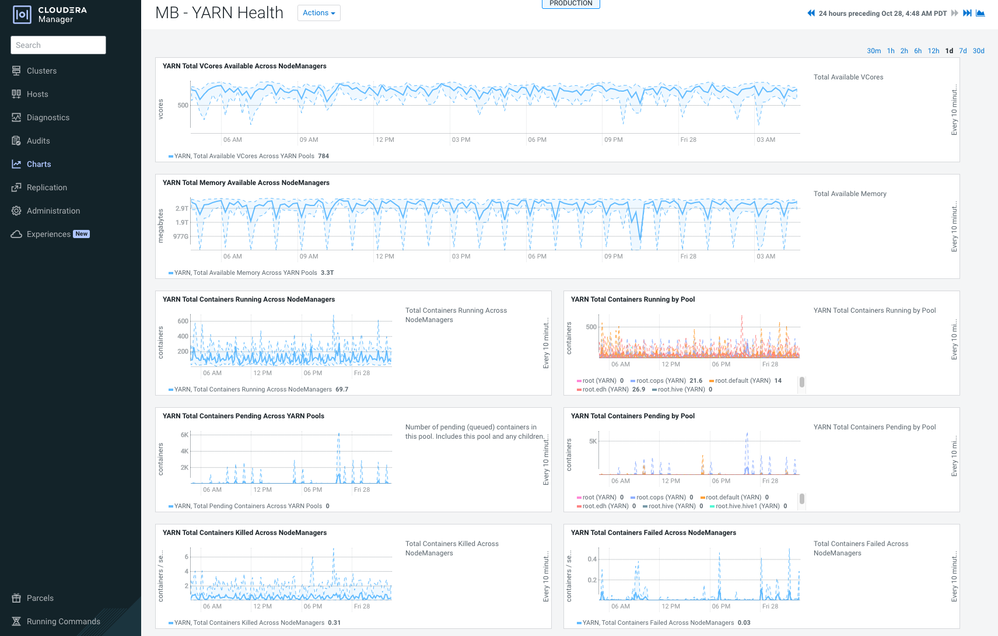
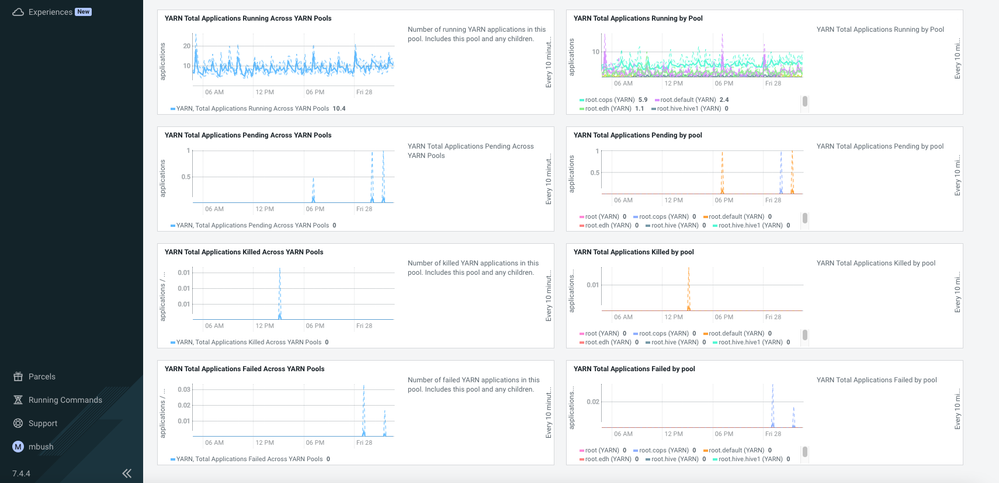
- MB - YARN Health
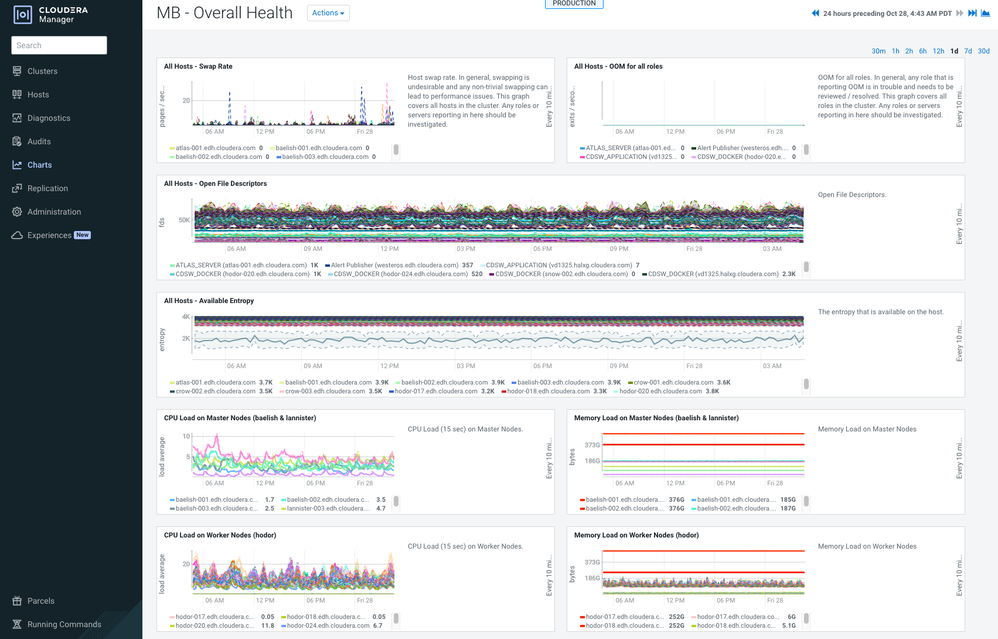
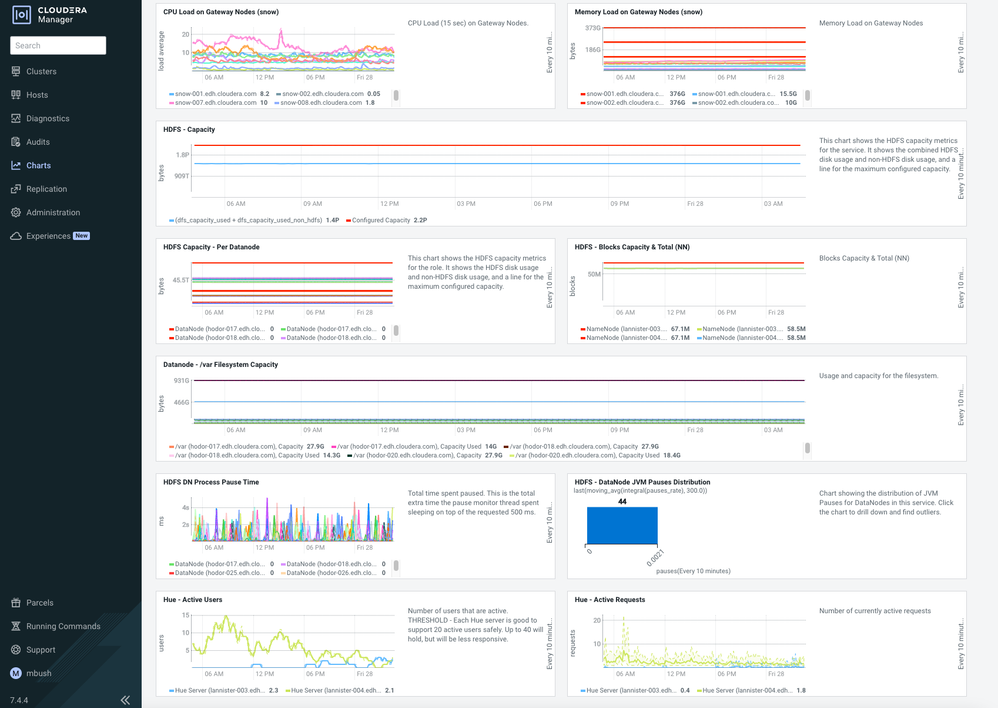
The Overall Health dashboard depicts a mix of insights across the entire cluster to identify abnormalities affecting any node when it comes to CPU, memory, etc.
NOTE: the ‘Time Series’ in the top right corner of every screenshot which shows the monitoring time period. The longer the time period set, the more skewed the statistics can become within the CM dashboard due to metric aggregation.
MB - Overall Health (screenshots)
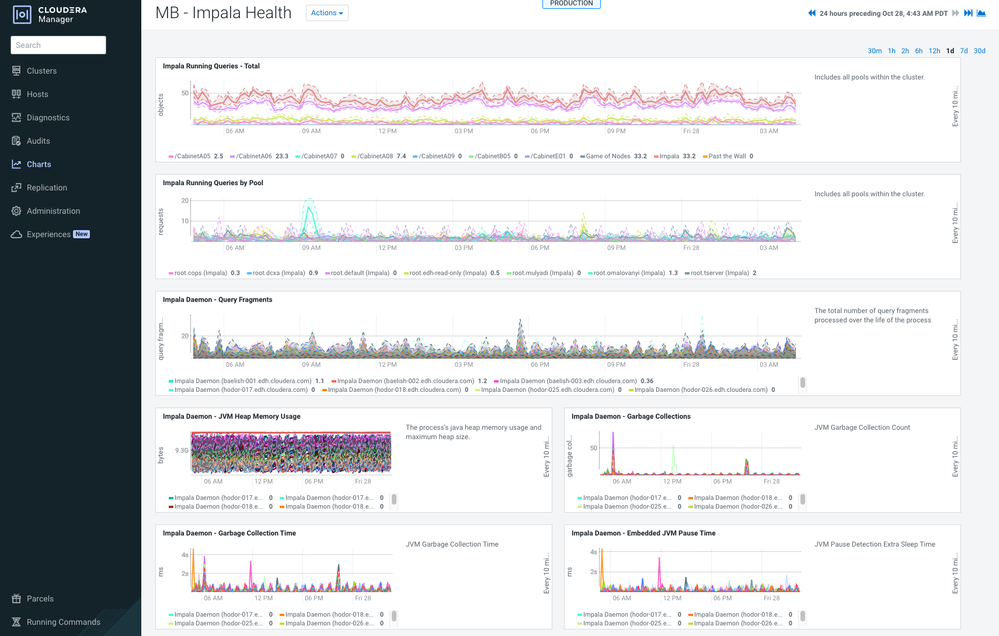
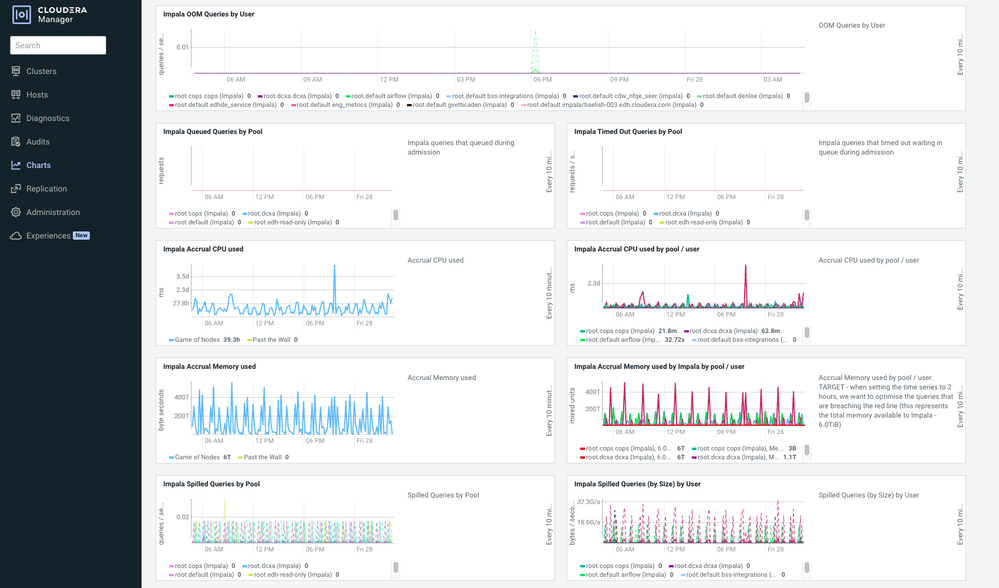
In any CDP cluster, it is important to verify that the Impala service is healthy. It is common to see that ETL-style workloads have been deployed within the Impala service, where Hive, Spark, or YARN would have been more suitable. The 3 dashboards depicted below can help analyze workload balance and provide valuable insights you can use to begin migrating those workloads from Impala to YARN.
MB - Impala Health (screenshots)
MB - YARN Health (screenshots)
Seven Weekly Dashboards
We recommend using the following dashboards weekly, or more frequently to identify unexpected behavior or instability within your cluster:
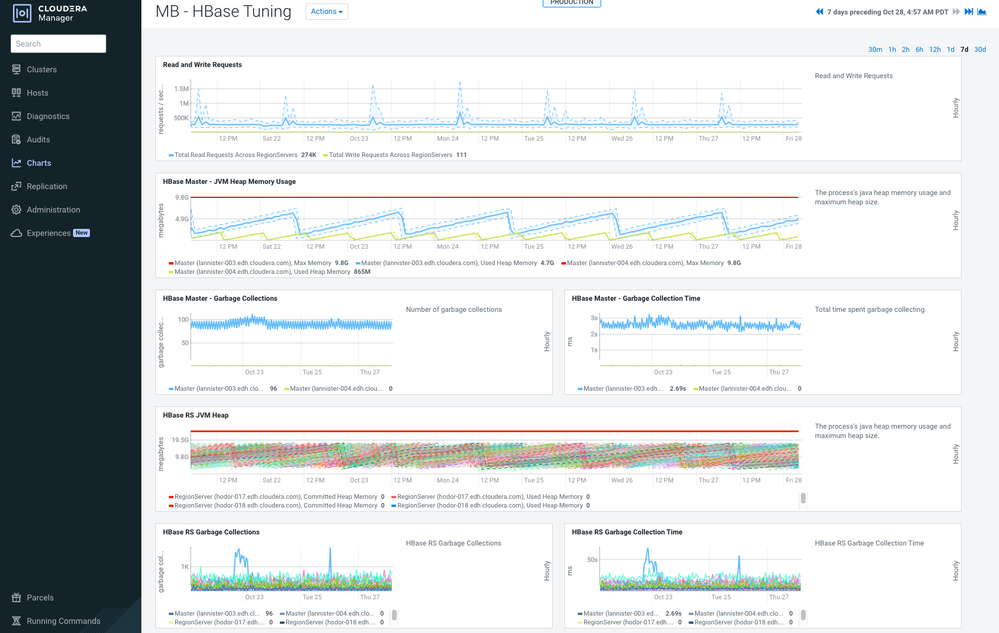
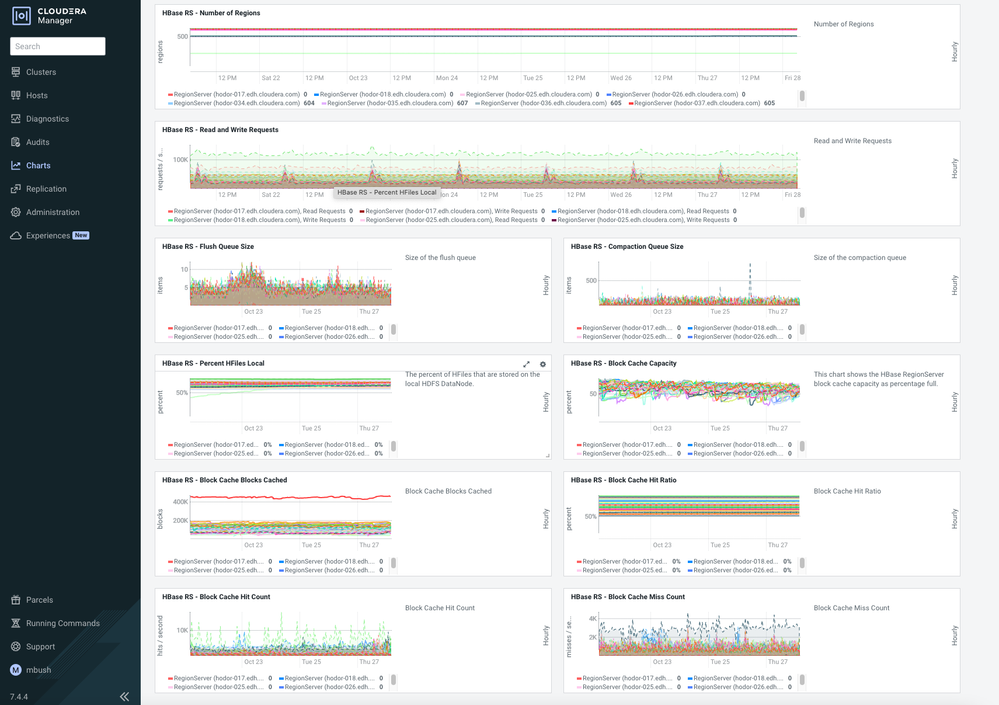
- MB - HBase Tuning
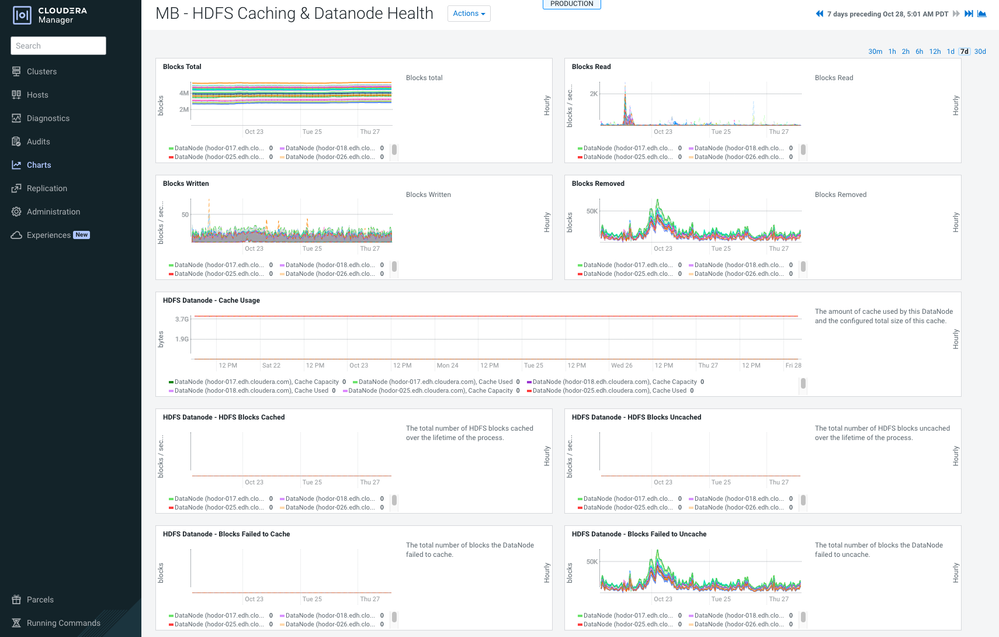
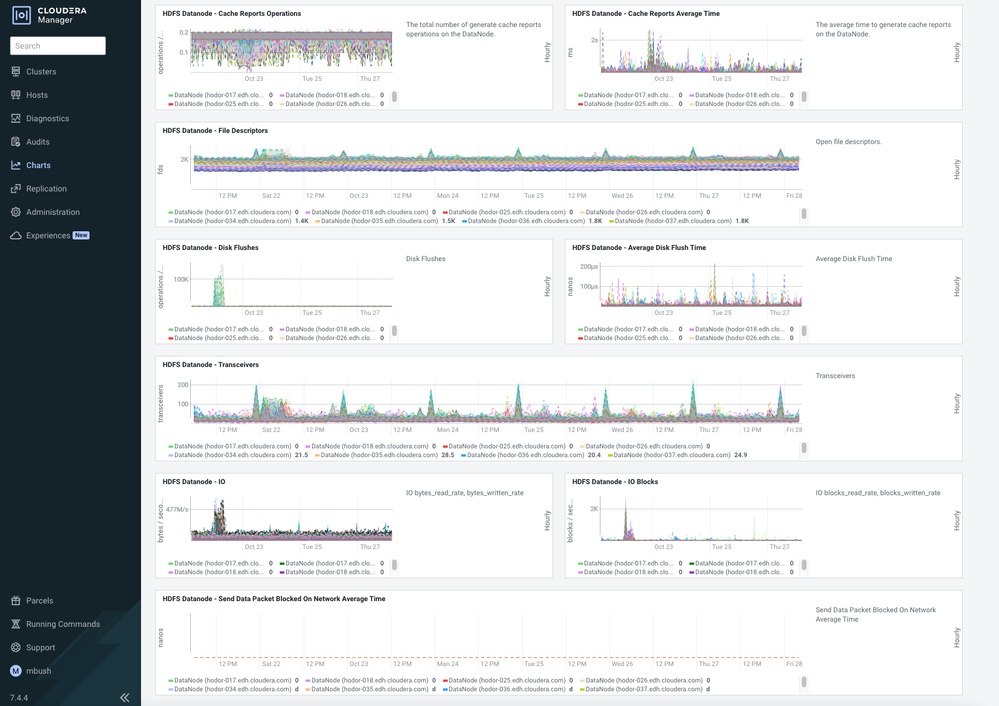
- HDFS Caching & Datanode Health
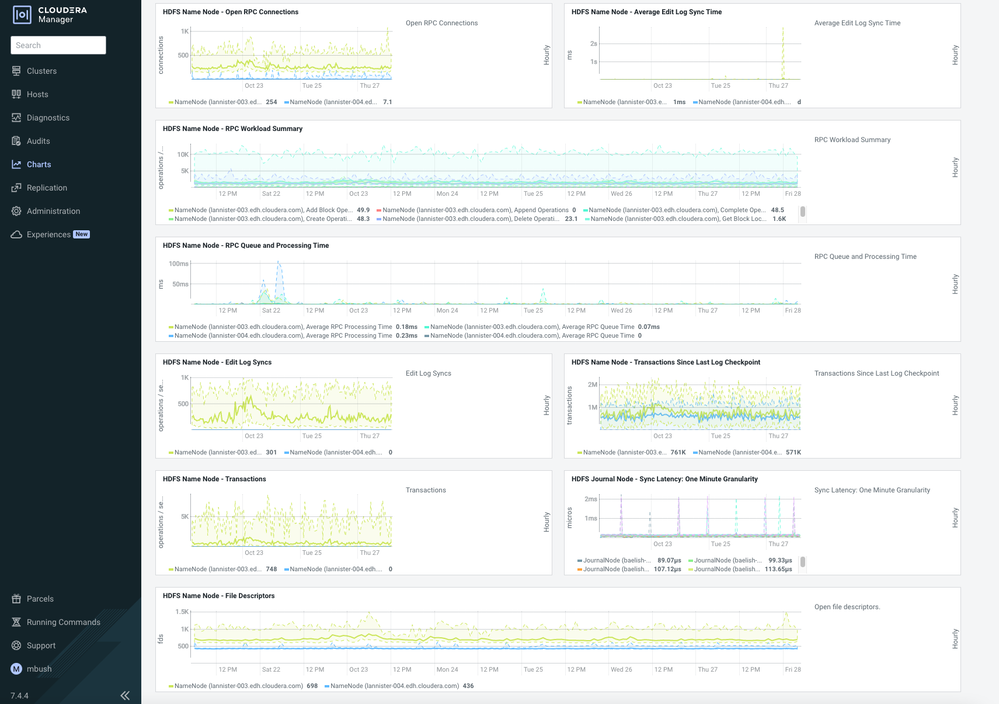
- MB - HDFS NN & JN Health
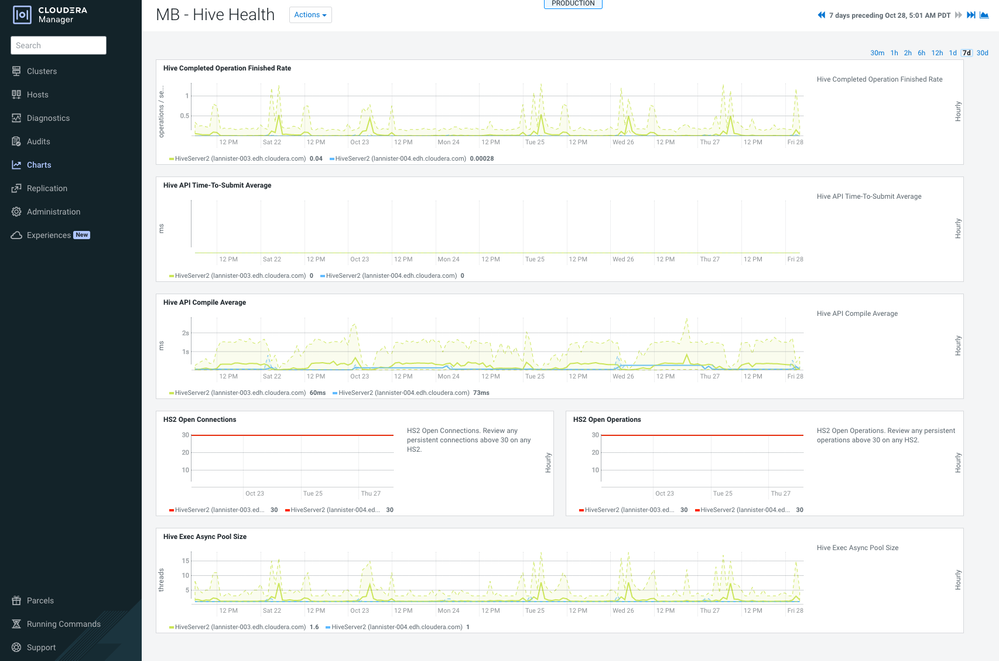
- MB - Hive Health
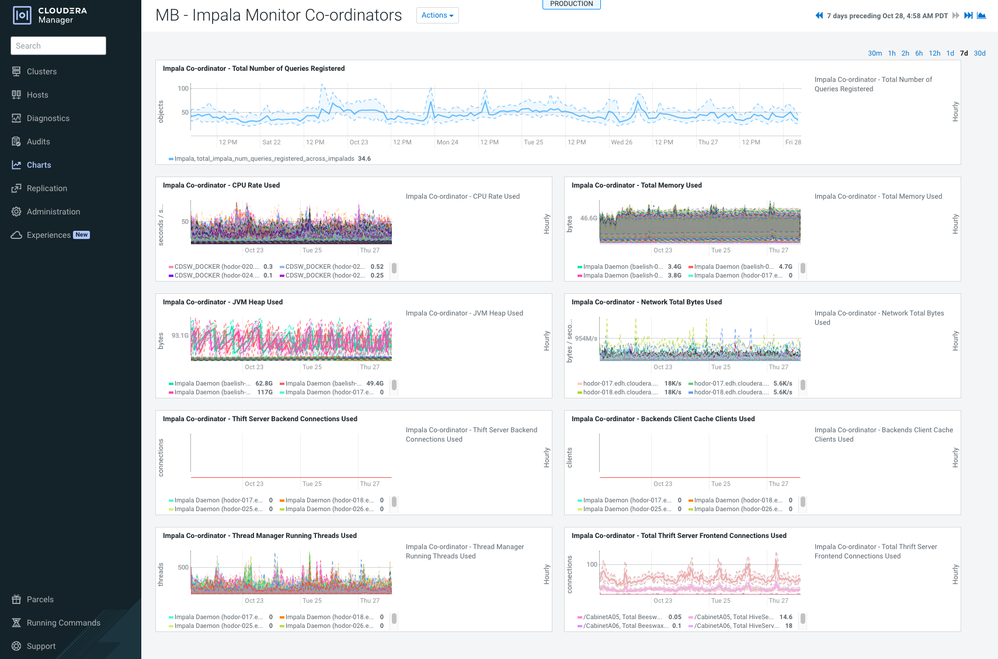
- MB - Impala Monitor Co-ordinators
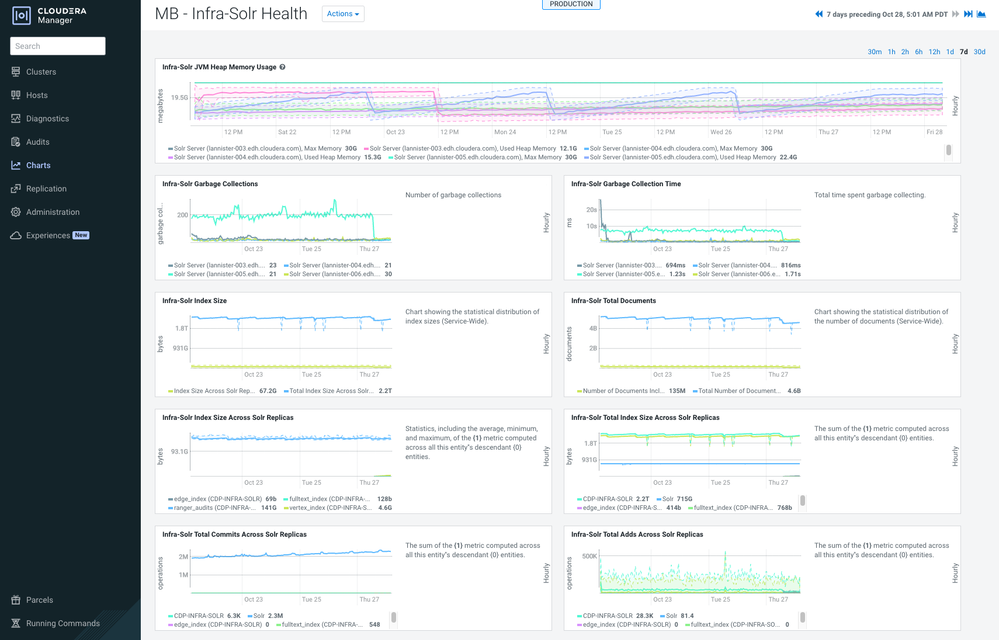
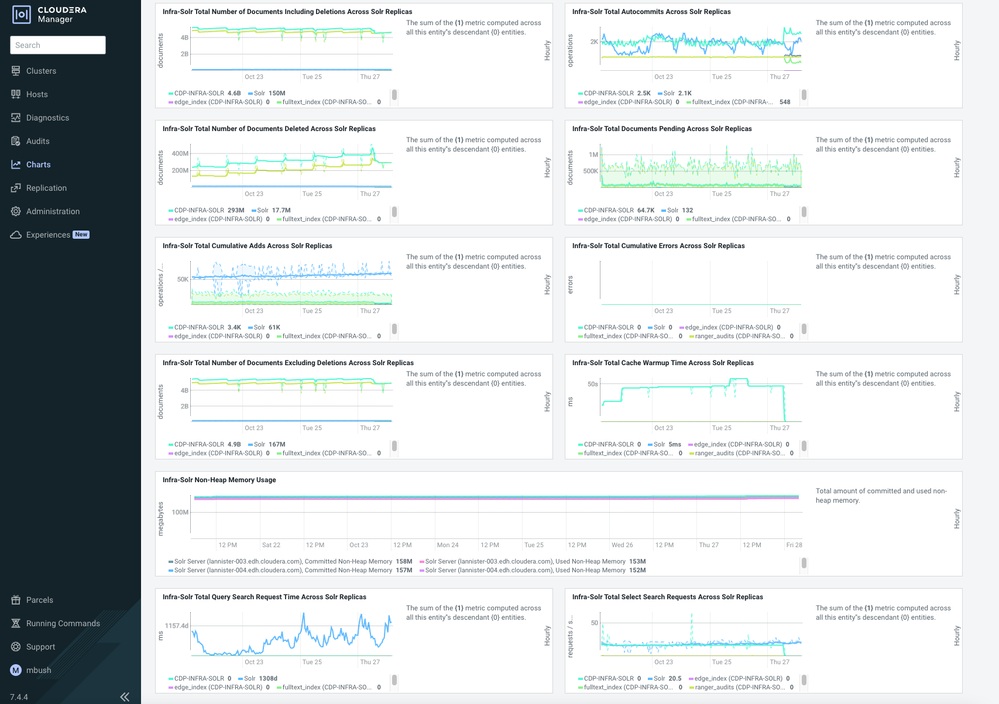
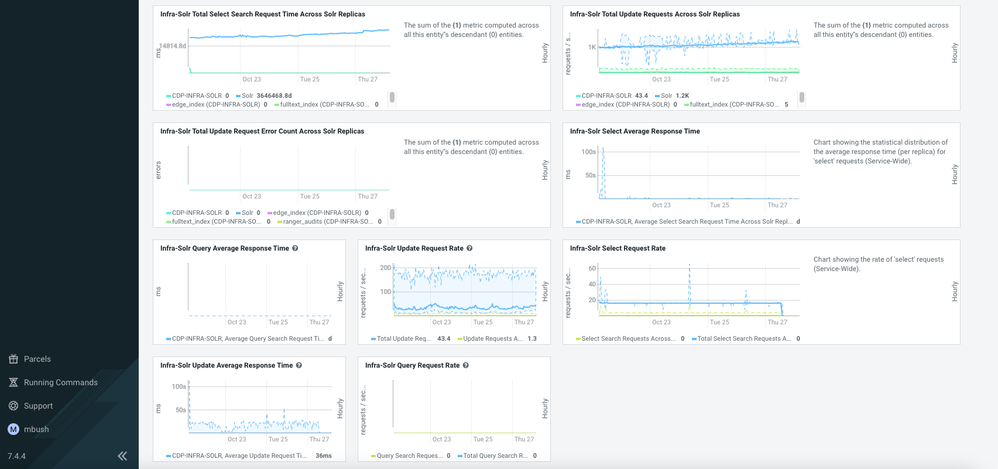
- MB - Infra-Solr Health
- MB - Solr Health
MB - HBase Tuning (screenshots)
HDFS Caching & Datanode Health (screenshots)
MB - HDFS NN & JN Health (screenshots)
MB - Hive Health (screenshots)
MB - Impala Monitor Co-ordinators (screenshots)
MB - Infra-Solr Health (screenshots)
MB - Solr Health (screenshots)
Three Monthly Dashboards
As with the Weekly Used Dashboards, these dashboards can quite often be used daily if identifying unexpected behavior or instability within the cluster but we recommend using them at least monthly to proactively identify that service/role heap sizing is in a healthy state:
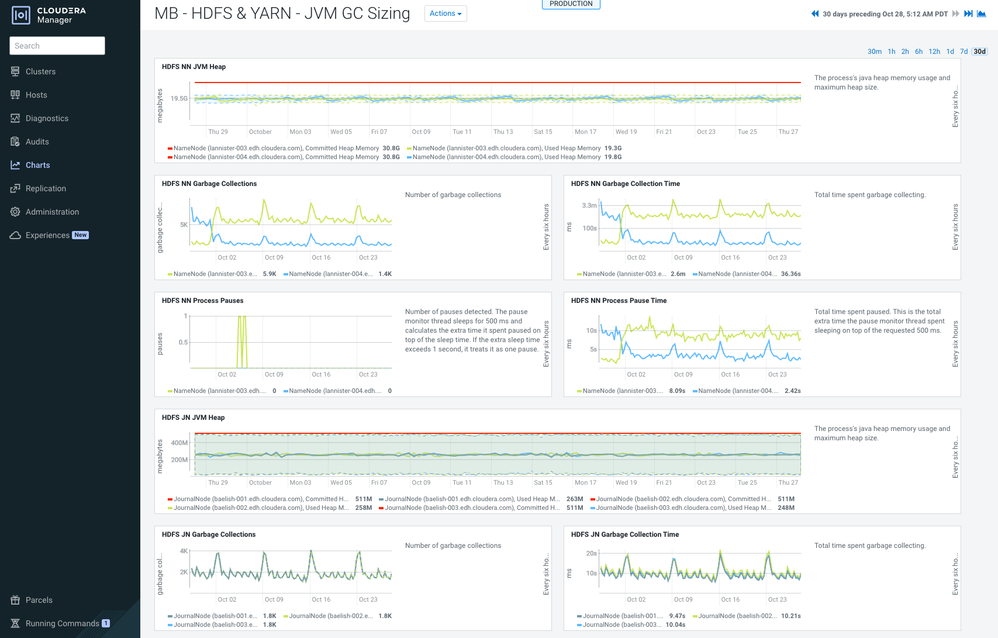
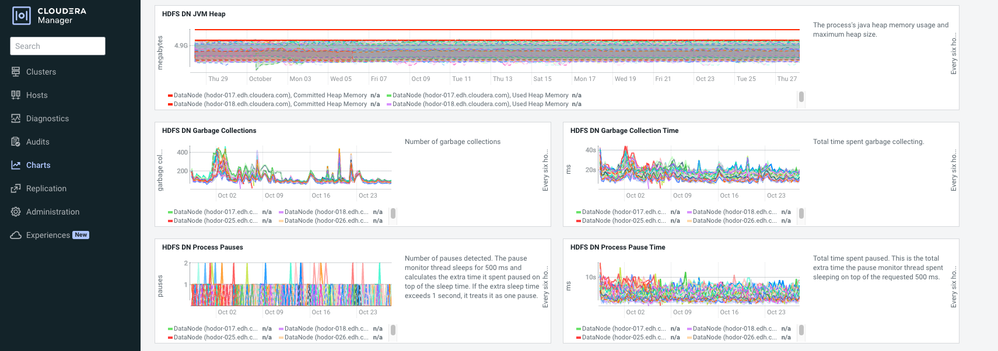
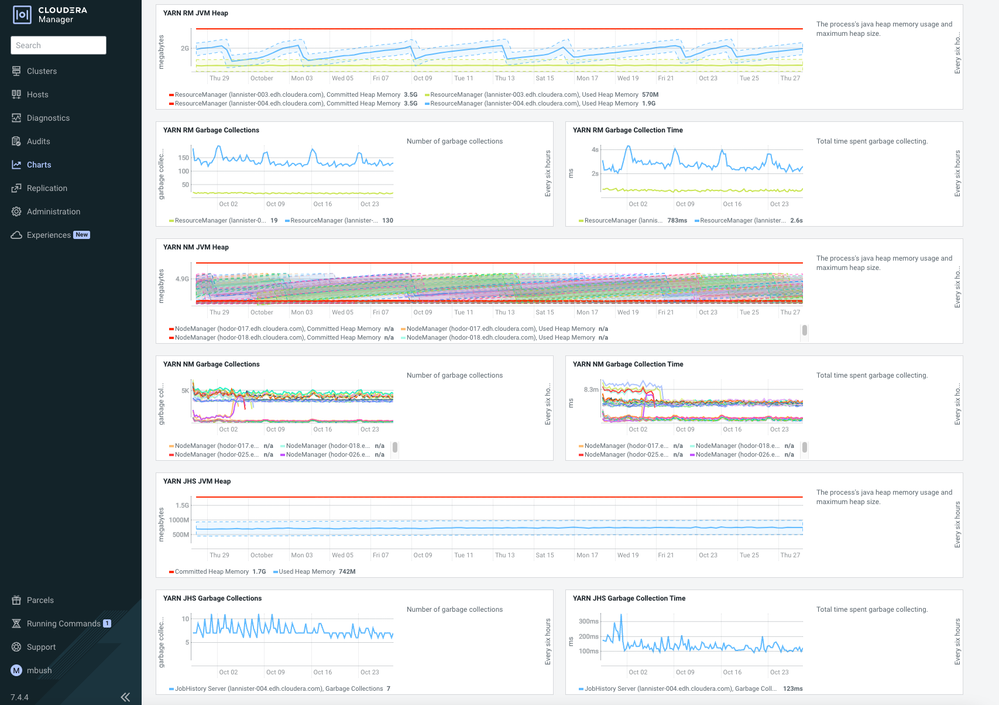
- MB - HDFS & YARN - JVM GC Sizing
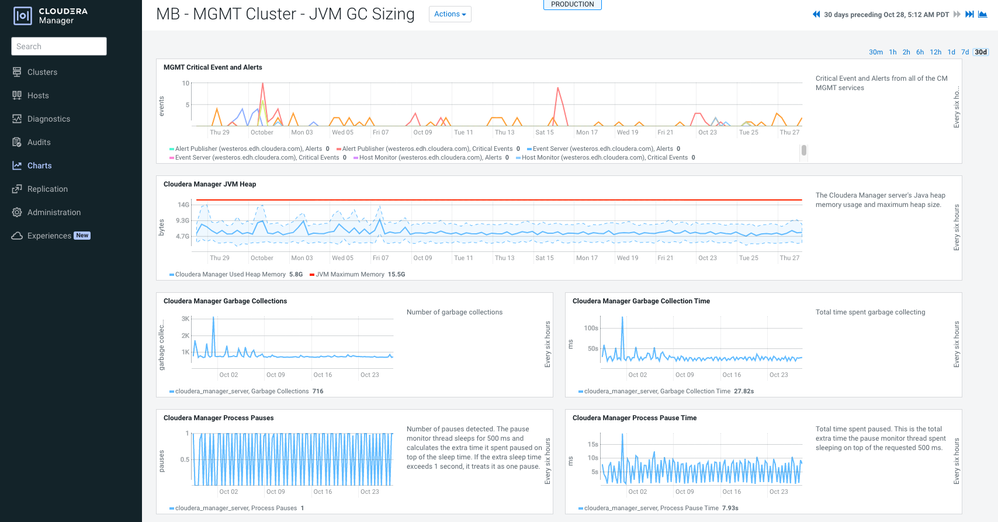
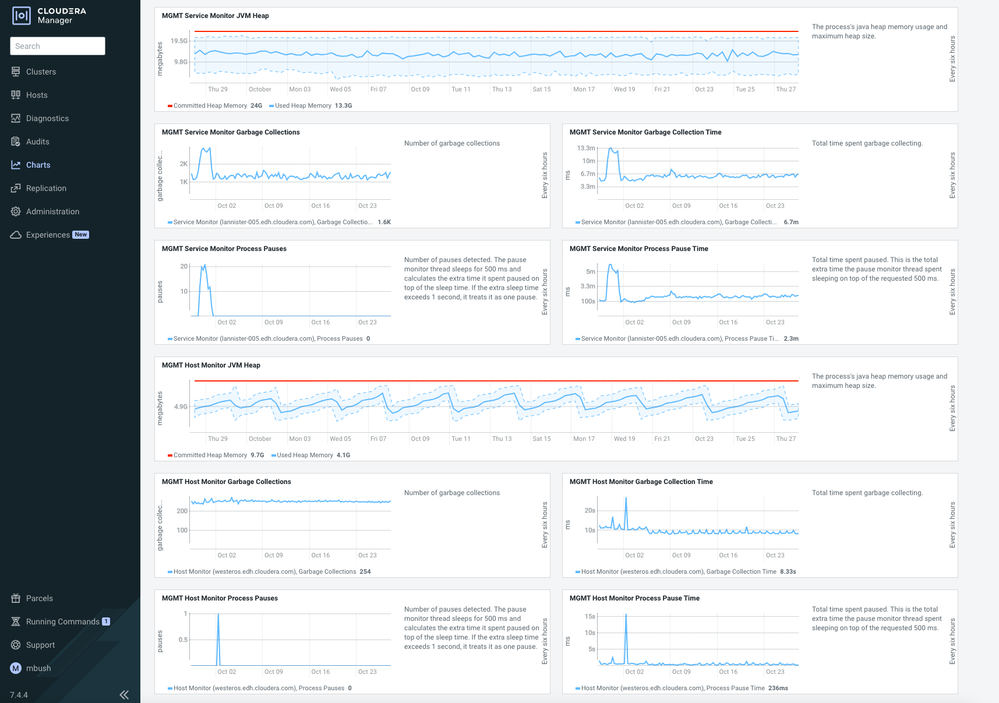
- MB - MGMT Cluster - JVM GC Sizing
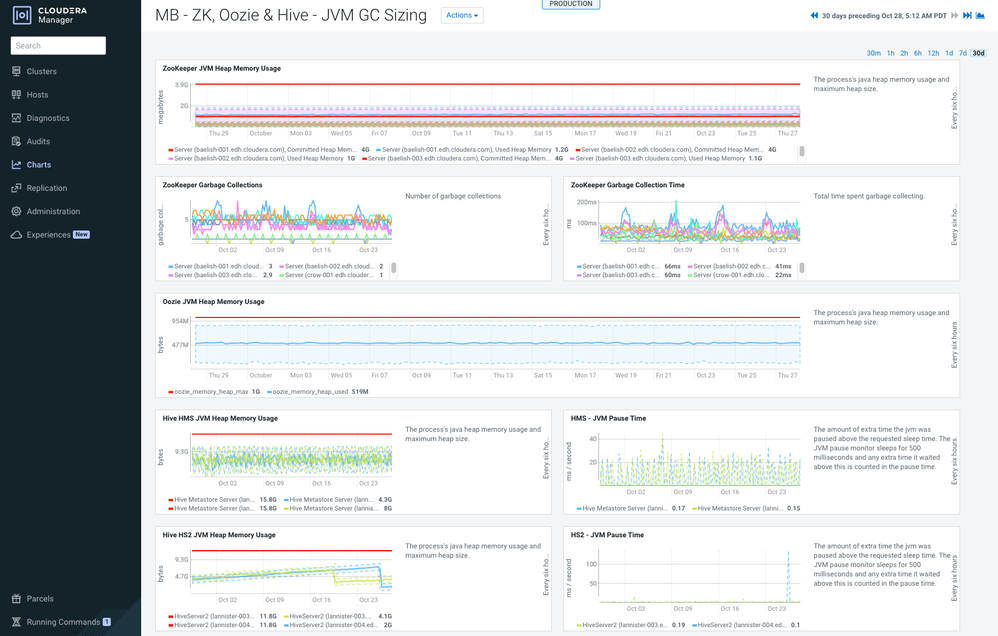
- MB - ZK, Oozie & Hive - JVM GC Sizing
MB - HDFS & YARN - JVM GC Sizing (screenshots)
MB - MGMT Cluster - JVM GC Sizing (screenshots)
MB - ZK, Oozie & Hive - JVM GC Sizing (screenshots)
Created on 11-30-2023 07:49 AM
- Mark as Read
- Mark as New
- Bookmark
- Permalink
- Report Inappropriate Content
Nice article! Where can we find the templates in Cloudera manager? You mention "we’re offering you JSON files of custom Cloudera Manager dashboards to import into your CM ’managed cluster", but do not give details on where customer can get the template files? Is that a separate license to purchase? It will be great to put the JSON files location details for the better use of the dashboards and this article. Thanks!


