
Our Community is getting an upgrade! To get everything ready for the relaunch, we’ll be placing the site in read-only mode starting September 21st.
We really appreciate your understanding while we get things set up behind the scenes. Catch up on all the exciting details about the move here.
Need help or have questions? Drop us a line at [email protected]

Archives of Support Questions (Read Only)
- Cloudera Community
- Board Archive
- Archives of Support Questions (Read Only)
- HDP Cluster failed starting after high availabilit...
- Subscribe to RSS Feed
- Mark Question as New
- Mark Question as Read
- Float this Question for Current User
- Bookmark
- Subscribe
- Mute
- Printer Friendly Page
- Subscribe to RSS Feed
- Mark Question as New
- Mark Question as Read
- Float this Question for Current User
- Bookmark
- Subscribe
- Mute
- Printer Friendly Page
HDP Cluster failed starting after high availability installation
- Labels:
-
Hortonworks Data Platform (HDP)


Created 03-07-2017 04:03 PM
- Mark as New
- Bookmark
- Subscribe
- Mute
- Subscribe to RSS Feed
- Permalink
- Report Inappropriate Content
Hi,
Today I added high availability to my 4 vm servers cluster.
After adding high availability for name node Grafana failed to start.
Same repeated when for adding HA to resource manager.
I started failed services one by one after both occurrences.
After this I wanted to test cluster's health with HA feature and stopped all services, started all services.
In addition to failing Grafana, all of the services have alerts now.
My cluster information:
Ambari 2.4.2
HDP 2.5.3
CentOS 7.3.1611
Grafana start errors:
stderr:
Traceback (most recent call last):
  File "/var/lib/ambari-agent/cache/common-services/AMBARI_METRICS/0.1.0/package/scripts/metrics_grafana.py", line 69, in <module>
    AmsGrafana().execute()
  File "/usr/lib/python2.6/site-packages/resource_management/libraries/script/script.py", line 280, in execute
    method(env)
  File "/var/lib/ambari-agent/cache/common-services/AMBARI_METRICS/0.1.0/package/scripts/metrics_grafana.py", line 50, in start
    create_ams_datasource()
  File "/var/lib/ambari-agent/cache/common-services/AMBARI_METRICS/0.1.0/package/scripts/metrics_grafana_util.py", line 261, in create_ams_datasource
    (response.status, response.reason, data))
resource_management.core.exceptions.Fail: Ambari Metrics Grafana data source creation failed. POST request status: 401 Unauthorized
{"message":"Invalid username or password"}
stdout:
2017-03-07 18:38:36,664 - Execute['/usr/sbin/ambari-metrics-grafana start'] {'not_if': "ambari-sudo.sh su ams -l -s /bin/bash -c 'test -f /var/run/ambari-metrics-grafana/grafana-server.pid && ps -p `cat /var/run/ambari-metrics-grafana/grafana-server.pid`'", 'user': 'ams'}
2017-03-07 18:38:37,924 - Checking if AMS Grafana datasource already exists
2017-03-07 18:38:37,925 - Connecting (GET) to bigdev1:3000/api/datasources
2017-03-07 18:38:38,006 - Http response: 401 Unauthorized
2017-03-07 18:38:38,006 - Error checking for Ambari Metrics Grafana datasource. Will attempt to create.
2017-03-07 18:38:38,006 - Generating datasource:

{
  "name": "AMBARI_METRICS",
  "type": "ambarimetrics",
  "access": "proxy",
  "url": "http://bigdev3:6188",
  "password": "",
  "user": "",
  "database": "",
  "basicAuth": false,
  "basicAuthUser": "",
  "basicAuthPassword": "",
  "withCredentials": false,
  "isDefault": true,
  "jsonData": {}
}
2017-03-07 18:38:38,007 - Connecting (POST) to bigdev1:3000/api/datasources
2017-03-07 18:38:38,101 - Http response: 401 Unauthorized
2017-03-07 18:38:48,111 - Connection to Grafana failed. Next retry in 10 seconds.
2017-03-07 18:38:48,112 - Connecting (POST) to bigdev1:3000/api/datasources
2017-03-07 18:38:48,176 - Http response: 401 Unauthorized
Does anybody know the underlying reason of it?
Any comments appreciated...


Created on 03-07-2017 04:05 PM - edited 08-19-2019 01:05 AM
- Mark as New
- Bookmark
- Subscribe
- Mute
- Subscribe to RSS Feed
- Permalink
- Report Inappropriate Content
please double check the Grafana password @Sedat Kestepe looks like you're not providing username and password in your API call. You can find it in the configs section of Ambari Metrics Service
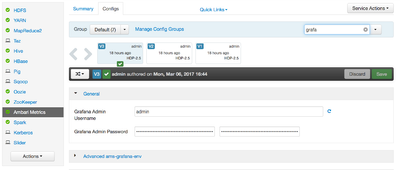
Fail: Ambari Metrics Grafana data source creation failed. POST request status: 401 Unauthorized {"message":"Invalid username or password"}
Created on 03-07-2017 04:05 PM - edited 08-19-2019 01:05 AM
- Mark as New
- Bookmark
- Subscribe
- Mute
- Subscribe to RSS Feed
- Permalink
- Report Inappropriate Content
please double check the Grafana password @Sedat Kestepe looks like you're not providing username and password in your API call. You can find it in the configs section of Ambari Metrics Service
Fail: Ambari Metrics Grafana data source creation failed. POST request status: 401 Unauthorized {"message":"Invalid username or password"}
Created 03-08-2017 07:15 AM
- Mark as New
- Bookmark
- Subscribe
- Mute
- Subscribe to RSS Feed
- Permalink
- Report Inappropriate Content
Thanks @Artem Ervits!
Although I remember that I set all required passwords during the installation, I did set a password for Grafana. Now I can stop and start all services.


