
Our Community is getting an upgrade! To get everything ready for the relaunch, we’ll be placing the site in read-only mode starting September 21st.
We really appreciate your understanding while we get things set up behind the scenes. Catch up on all the exciting details about the move here.
Need help or have questions? Drop us a line at [email protected]

Archives of Support Questions (Read Only)
- Cloudera Community
- Board Archive
- Archives of Support Questions (Read Only)
- Problem with Ambari Metrics
- Subscribe to RSS Feed
- Mark Question as New
- Mark Question as Read
- Float this Question for Current User
- Bookmark
- Subscribe
- Mute
- Printer Friendly Page
- Subscribe to RSS Feed
- Mark Question as New
- Mark Question as Read
- Float this Question for Current User
- Bookmark
- Subscribe
- Mute
- Printer Friendly Page
Problem with Ambari Metrics
- Labels:
-
Apache Ambari


Created 12-22-2016 09:14 AM
- Mark as New
- Bookmark
- Subscribe
- Mute
- Subscribe to RSS Feed
- Permalink
- Report Inappropriate Content
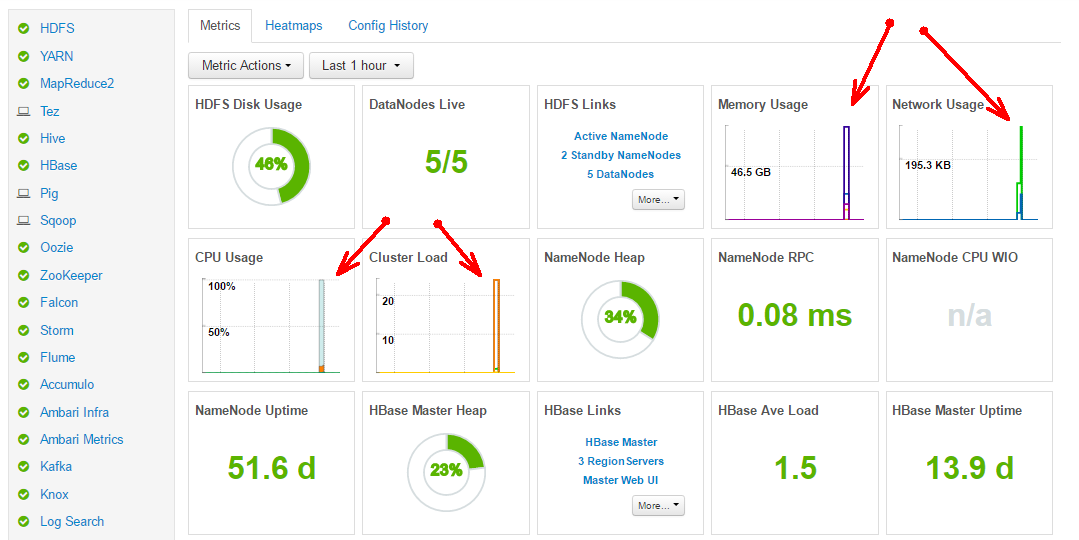
Ambari Metrics works intermittently. It works a few minutes and then stops to show pictures. Sometimes, the Metric Collector just stops, after a manual start it's working but in a few minutes it stops again. What is going wrong?
My settings
HDP 2.5
Ambari 2.4.0.1
No Kerberos
iptables off
hbase.zookeeper.property.tickTime = 6000
Metrics Service operation mode = distributed
hbase.cluster.distributed = true
hbase.zookeeper.property.clientPort = 2181
hbase.rootdir=hdfs://prodcluster/ams/hbase
Logs
ambari-metrics-collector.log

2016-12-22 11:59:23,030 ERROR org.mortbay.log: /ws/v1/timeline/metrics
javax.ws.rs.WebApplicationException: javax.xml.bind.MarshalException
 - with linked exception:
[org.mortbay.jetty.EofException]
        at com.sun.jersey.core.provider.jaxb.AbstractRootElementProvider.writeTo(AbstractRootElementProvider.java:159)
        at com.sun.jersey.spi.container.ContainerResponse.write(ContainerResponse.java:306)
        at com.sun.jersey.server.impl.application.WebApplicationImpl._handleRequest(WebApplicationImpl.java:1437)
        at com.sun.jersey.server.impl.application.WebApplicationImpl.handleRequest(WebApplicationImpl.java:1349)
        at com.sun.jersey.server.impl.application.WebApplicationImpl.handleRequest(WebApplicationImpl.java:1339)
        at com.sun.jersey.spi.container.servlet.WebComponent.service(WebComponent.java:416)
        at com.sun.jersey.spi.container.servlet.ServletContainer.service(ServletContainer.java:537)
        at com.sun.jersey.spi.container.servlet.ServletContainer.doFilter(ServletContainer.java:895)
        at com.sun.jersey.spi.container.servlet.ServletContainer.doFilter(ServletContainer.java:843)
        at com.sun.jersey.spi.container.servlet.ServletContainer.doFilter(ServletContainer.java:804)
        at com.google.inject.servlet.FilterDefinition.doFilter(FilterDefinition.java:163)
        at com.google.inject.servlet.FilterChainInvocation.doFilter(FilterChainInvocation.java:58)
        at com.google.inject.servlet.ManagedFilterPipeline.dispatch(ManagedFilterPipeline.java:118)
        at com.google.inject.servlet.GuiceFilter.doFilter(GuiceFilter.java:113)
        at org.mortbay.jetty.servlet.ServletHandler$CachedChain.doFilter(ServletHandler.java:1212)
        at org.apache.hadoop.security.http.XFrameOptionsFilter.doFilter(XFrameOptionsFilter.java:57)
        at org.mortbay.jetty.servlet.ServletHandler$CachedChain.doFilter(ServletHandler.java:1212)
        at org.apache.hadoop.http.lib.StaticUserWebFilter$StaticUserFilter.doFilter(StaticUserWebFilter.java:109)
        at org.mortbay.jetty.servlet.ServletHandler$CachedChain.doFilter(ServletHandler.java:1212)
        at org.apache.hadoop.http.HttpServer2$QuotingInputFilter.doFilter(HttpServer2.java:1294)
        at org.mortbay.jetty.servlet.ServletHandler$CachedChain.doFilter(ServletHandler.java:1212)
        at org.apache.hadoop.http.NoCacheFilter.doFilter(NoCacheFilter.java:45)
        at org.mortbay.jetty.servlet.ServletHandler$CachedChain.doFilter(ServletHandler.java:1212)
        at org.mortbay.jetty.servlet.ServletHandler.handle(ServletHandler.java:399)
        at org.mortbay.jetty.security.SecurityHandler.handle(SecurityHandler.java:216)
        at org.mortbay.jetty.servlet.SessionHandler.handle(SessionHandler.java:182)
        at org.mortbay.jetty.handler.ContextHandler.handle(ContextHandler.java:767)
        at org.mortbay.jetty.webapp.WebAppContext.handle(WebAppContext.java:450)
        at org.mortbay.jetty.handler.ContextHandlerCollection.handle(ContextHandlerCollection.java:230)
        at org.mortbay.jetty.handler.HandlerWrapper.handle(HandlerWrapper.java:152)
        at org.mortbay.jetty.Server.handle(Server.java:326)
        at org.mortbay.jetty.HttpConnection.handleRequest(HttpConnection.java:542)
        at org.mortbay.jetty.HttpConnection$RequestHandler.content(HttpConnection.java:945)
        at org.mortbay.jetty.HttpParser.parseNext(HttpParser.java:756)
        at org.mortbay.jetty.HttpParser.parseAvailable(HttpParser.java:218)
        at org.mortbay.jetty.HttpConnection.handle(HttpConnection.java:404)
        at org.mortbay.io.nio.SelectChannelEndPoint.run(SelectChannelEndPoint.java:410)
        at org.mortbay.thread.QueuedThreadPool$PoolThread.run(QueuedThreadPool.java:582)
Caused by: javax.xml.bind.MarshalException
 - with linked exception:
[org.mortbay.jetty.EofException]
        at com.sun.xml.bind.v2.runtime.MarshallerImpl.write(MarshallerImpl.java:325)
        at com.sun.xml.bind.v2.runtime.MarshallerImpl.marshal(MarshallerImpl.java:249)
        at javax.xml.bind.helpers.AbstractMarshallerImpl.marshal(AbstractMarshallerImpl.java:95)
        at com.sun.jersey.core.provider.jaxb.AbstractRootElementProvider.writeTo(AbstractRootElementProvider.java:179)
        at com.sun.jersey.core.provider.jaxb.AbstractRootElementProvider.writeTo(AbstractRootElementProvider.java:157)
        ... 37 more
Caused by: org.mortbay.jetty.EofException
        at org.mortbay.jetty.AbstractGenerator$Output.write(AbstractGenerator.java:634)
        at org.mortbay.jetty.AbstractGenerator$Output.write(AbstractGenerator.java:580)
        at com.sun.jersey.spi.container.servlet.WebComponent$Writer.write(WebComponent.java:307)
        at com.sun.jersey.spi.container.ContainerResponse$CommittingOutputStream.write(ContainerResponse.java:134)
        at com.sun.xml.bind.v2.runtime.output.UTF8XmlOutput.flushBuffer(UTF8XmlOutput.java:416)
        at com.sun.xml.bind.v2.runtime.output.UTF8XmlOutput.endDocument(UTF8XmlOutput.java:141)
        at com.sun.xml.bind.v2.runtime.XMLSerializer.endDocument(XMLSerializer.java:856)
        at com.sun.xml.bind.v2.runtime.MarshallerImpl.postwrite(MarshallerImpl.java:374)
        at com.sun.xml.bind.v2.runtime.MarshallerImpl.write(MarshallerImpl.java:321)
        ... 41 more
2016-12-22 12:00:05,549 INFO TimelineClusterAggregatorMinute: 0 row(s) updated.
2016-12-22 12:00:19,105 INFO TimelineClusterAggregatorMinute: Aggregated cluster metrics for METRIC_AGGREGATE_MINUTE, with startTime = Thu Dec 22 11:50:00 MSK 2016, endTime = Thu Dec 22 11:55:00 MSK 2016
2016-12-22 12:00:19,111 INFO TimelineClusterAggregatorMinute: End aggregation cycle @ Thu Dec 22 12:00:19 MSK 2016
2016-12-22 12:00:19,111 INFO TimelineClusterAggregatorMinute: End aggregation cycle @ Thu Dec 22 12:00:19 MSK 2016
2016-12-22 12:00:24,077 INFO TimelineClusterAggregatorMinute: Started Timeline aggregator thread @ Thu Dec 22 12:00:24 MSK 2016
2016-12-22 12:00:24,083 INFO TimelineClusterAggregatorMinute: Last Checkpoint read : Thu Dec 22 11:55:00 MSK 2016
2016-12-22 12:00:24,083 INFO TimelineClusterAggregatorMinute: Rounded off checkpoint : Thu Dec 22 11:55:00 MSK 2016
2016-12-22 12:00:24,084 INFO TimelineClusterAggregatorMinute: Last check point time: 1482396900000, lagBy: 324 seconds.
2016-12-22 12:00:24,085 INFO TimelineClusterAggregatorMinute: Start aggregation cycle @ Thu Dec 22 12:00:24 MSK 2016, startTime = Thu Dec 22 11:55:00 MSK 2016, endTime = Thu Dec 22 12:00:00 MSK 2016
hbase-ams-master-hdp-nn2.hostname.log

2016-12-22 11:22:46,455 INFO  [hdp-nn2.hostname,61300,1482394421267_ChoreService_1] zookeeper.ZooKeeper: Session: 0x3570f2523bb3db4 closed
2016-12-22 11:22:46,455 INFO  [hdp-nn2.hostname,61300,1482394421267_ChoreService_1-EventThread] zookeeper.ClientCnxn: EventThread shut down
2016-12-22 11:23:31,207 INFO  [timeline] timeline.HadoopTimelineMetricsSink: Unable to connect to collector, http://hdp-nn2.hostname:6188/ws/v1/timeline/metrics
This exceptions will be ignored for next 100 times


2016-12-22 11:23:31,208 WARN  [timeline] timeline.HadoopTimelineMetricsSink: Unable to send metrics to collector by address:http://hdp-nn2.hostname:6188/ws/v1/timeline/metrics
2016-12-22 11:23:41,484 INFO  [LruBlockCacheStatsExecutor] hfile.LruBlockCache: totalSize=159.41 KB, freeSize=150.39 MB, max=150.54 MB, blockCount=0, accesses=0, hits=0, hitRatio=0, cachingAccesses=0, cachingHits=0, cachingHitsRatio=0,evictions=59, evicted=0, evictedPerRun=0.0
2016-12-22 11:23:46,460 INFO  [hdp-nn2.hostname,61300,1482394421267_ChoreService_1] zookeeper.RecoverableZooKeeper: Process identifier=hconnection-0x12f8ba29 connecting to ZooKeeper ensemble=hdp-nn1.hostname:2181,hdp-dn1.hostname:2181,hdp-nn2.hostname:2181
2016-12-22 11:23:46,461 INFO  [hdp-nn2.hostname,61300,1482394421267_ChoreService_1] zookeeper.ZooKeeper: Initiating client connection, connectString=hdp-nn1.hostname:2181,hdp-dn1.hostname:2181,hdp-nn2.hostname:2181 sessionTimeout=120000 watcher=org.apache.hadoop.hbase.zookeeper.PendingWatcher@20fc295f
2016-12-22 11:23:46,464 INFO  [hdp-nn2.hostname,61300,1482394421267_ChoreService_1-SendThread(hdp-nn2.hostname:2181)] zookeeper.ClientCnxn: Opening socket connection to server hdp-nn2.hostname/10.255.242.181:2181. Will not attempt to authenticate using SASL (unknown error)
2016-12-22 11:23:46,466 INFO  [hdp-nn2.hostname,61300,1482394421267_ChoreService_1-SendThread(hdp-nn2.hostname:2181)] zookeeper.ClientCnxn: Socket connection established to hdp-nn2.hostname/10.255.242.181:2181, initiating session
2016-12-22 11:23:46,469 INFO  [hdp-nn2.hostname,61300,1482394421267_ChoreService_1-SendThread(hdp-nn2.hostname:2181)] zookeeper.ClientCnxn: Session establishment complete on server hdp-nn2.hostname/10.255.242.181:2181, sessionid = 0x3570f2523bb3db5, negotiated timeout = 40000
2016-12-22 11:23:46,495 INFO  [hdp-nn2.hostname,61300,1482394421267_ChoreService_1] client.ConnectionManager$HConnectionImplementation: Closing zookeeper sessionid=0x3570f2523bb3db5
2016-12-22 11:23:46,499 INFO  [hdp-nn2.hostname,61300,1482394421267_ChoreService_1] zookeeper.ZooKeeper: Session: 0x3570f2523bb3db5 closed
2016-12-22 11:23:46,499 INFO  [hdp-nn2.hostname,61300,1482394421267_ChoreService_1-EventThread] zookeeper.ClientCnxn: EventThread shut down
2016-12-22 11:28:41,485 INFO  [LruBlockCacheStatsExecutor] hfile.LruBlockCache: totalSize=159.41 KB, freeSize=150.39 MB, max=150.54 MB, blockCount=0, accesses=0, hits=0, hitRatio=0, cachingAccesses=0, cachingHits=0, cachingHitsRatio=0,evictions=89, evicted=0, evictedPerRun=0.0
2016-12-22 11:29:49,178 INFO  [WALProcedureStoreSyncThread] wal.WALProcedureStore: Remove log: hdfs://prodcluster/ams/hbase/MasterProcWALs/state-00000000000000000001.log
2016-12-22 11:29:49,180 INFO  [WALProcedureStoreSyncThread] wal.WALProcedureStore: Removed logs: [hdfs://prodcluster/ams/hbase/MasterProcWALs/state-00000000000000000002.log]
2016-12-22 11:33:41,484 INFO  [LruBlockCacheStatsExecutor] hfile.LruBlockCache: totalSize=159.41 KB, freeSize=150.39 MB, max=150.54 MB, blockCount=0, accesses=0, hits=0, hitRatio=0, cachingAccesses=0, cachingHits=0, cachingHitsRatio=0,evictions=119, evicted=0, evictedPerRun=0.0
2016-12-22 11:38:41,484 INFO  [LruBlockCacheStatsExecutor] hfile.LruBlockCache: totalSize=159.41 KB, freeSize=150.39 MB, max=150.54 MB, blockCount=0, accesses=0, hits=0, hitRatio=0, cachingAccesses=0, cachingHits=0, cachingHitsRatio=0,evictions=149, evicted=0, evictedPerRun=0.0
2016-12-22 11:43:41,485 INFO  [LruBlockCacheStatsExecutor] hfile.LruBlockCache: totalSize=159.41 KB, freeSize=150.39 MB, max=150.54 MB, blockCount=0, accesses=0, hits=0, hitRatio=0, cachingAccesses=0, cachingHits=0, cachingHitsRatio=0,evictions=179, evicted=0, evictedPerRun=0.0
2016-12-22 11:44:51,222 INFO  [timeline] timeline.HadoopTimelineMetricsSink: Unable to connect to collector, http://hdp-nn2.hostname:6188/ws/v1/timeline/metrics
This exceptions will be ignored for next 100 times


2016-12-22 11:44:51,223 WARN  [timeline] timeline.HadoopTimelineMetricsSink: Unable to send metrics to collector by address:http://hdp-nn2.hostname:6188/ws/v1/timeline/metrics
2016-12-22 11:48:41,484 INFO  [LruBlockCacheStatsExecutor] hfile.LruBlockCache: totalSize=159.41 KB, freeSize=150.39 MB, max=150.54 MB, blockCount=0, accesses=0, hits=0, hitRatio=0, cachingAccesses=0, cachingHits=0, cachingHitsRatio=0,evictions=209, evicted=0, evictedPerRun=0.0
2016-12-22 11:50:51,205 INFO  [timeline] timeline.HadoopTimelineMetricsSink: Unable to connect to collector, http://hdp-nn2.hostname:6188/ws/v1/timeline/metrics
This exceptions will be ignored for next 100 times


2016-12-22 11:50:51,205 WARN  [timeline] timeline.HadoopTimelineMetricsSink: Unable to send metrics to collector by address:http://hdp-nn2.hostname:6188/ws/v1/timeline/metrics
I removed folder /var/lib/ambari-metrics-collector/hbase-tmp and restarted AMS as recommended here https://community.hortonworks.com/articles/11805/how-to-solve-ambari-metrics-corrupted-data.html, but it did not help.
Created 12-27-2016 05:00 AM
- Mark as New
- Bookmark
- Subscribe
- Mute
- Subscribe to RSS Feed
- Permalink
- Report Inappropriate Content
Yesterday suddenly Ambari Metrics has started working (and still works). The only thing I have changed yesterday - install Apache Atlas, which required restart almost all components, may be it helped. Thanks for your assistance!


Created on 11-04-2019 11:36 PM - edited 11-05-2019 01:03 AM
- Mark as New
- Bookmark
- Subscribe
- Mute
- Subscribe to RSS Feed
- Permalink
- Report Inappropriate Content
You need to stop ambari metrics service via ambari and then remove all temp files. Go to Ambari Metrics collector service host. and execute the below command.
mv /var/lib/ambari-metrics-collector /tmp/ambari-metrics-collector_OLD
Now you can restart ams service again and now you should be good with Ambari Metrics.


Created 02-20-2018 07:25 AM
- Mark as New
- Bookmark
- Subscribe
- Mute
- Subscribe to RSS Feed
- Permalink
- Report Inappropriate Content
I am having the same problem. Here is ambari-metrics-collector.log.

- « Previous
-
- 1
- 2
- Next »

