
Our Community is getting an upgrade! To get everything ready for the relaunch, we’ll be placing the site in read-only mode starting September 21st.
We really appreciate your understanding while we get things set up behind the scenes. Catch up on all the exciting details about the move here.
Need help or have questions? Drop us a line at [email protected]

Archives of Support Questions (Read Only)
- Cloudera Community
- Board Archive
- Archives of Support Questions (Read Only)
- R plots in Zeppelin look fuzzy
- Subscribe to RSS Feed
- Mark Question as New
- Mark Question as Read
- Float this Question for Current User
- Bookmark
- Subscribe
- Mute
- Printer Friendly Page
- Subscribe to RSS Feed
- Mark Question as New
- Mark Question as Read
- Float this Question for Current User
- Bookmark
- Subscribe
- Mute
- Printer Friendly Page
R plots in Zeppelin look fuzzy
- Labels:
-
Apache Zeppelin


Created on 08-24-2017 11:22 PM - edited 08-17-2019 05:16 PM
- Mark as New
- Bookmark
- Subscribe
- Mute
- Subscribe to RSS Feed
- Permalink
- Report Inappropriate Content
R's ggplot2 is a popular and versatile data visualization package.
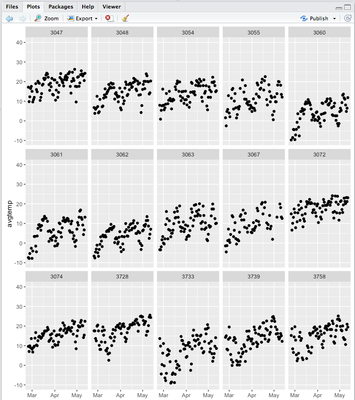
The facet plots are a particularly useful method to identify characteristics and anomalies. We can break a scatter plot into facets simply by adding + facet_wrap(~myVar) to an existing plot. Here's an example plot (screenshot from RStudio):
Zeppelin supports the R interpreter. Providing R is installed, we can run R commands inside a notebook cell:
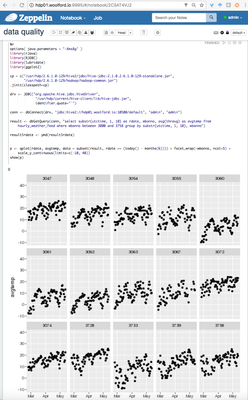
In this case, we ran a Hive query and created a facet plot.
The question: it looks to me like Zeppelin has created a raster image that's been upscaled and therefore looks fuzzy. In RStudio, the plots look a lot crisper.
I notice that there's an open JIRA for this: https://issues.apache.org/jira/browse/ZEPPELIN-1445
Is there a way to make ggplots look crisp in Zeppelin? Is there a way to render plots as PDF's, i.e. a vector format that doesn't get blurry when scaled, and then display those PDF's inside of the Zeppelin notebook?
Created on 08-25-2017 05:25 AM - edited 08-17-2019 05:16 PM
- Mark as New
- Bookmark
- Subscribe
- Mute
- Subscribe to RSS Feed
- Permalink
- Report Inappropriate Content
Zeppelin stores a lot of settings in interpreter.json
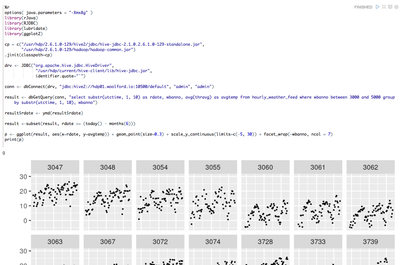
The default dpi (dots per inch) for R plot is 72, hence the blurry plots. This value can be increased by adding a dpi property to Zeppelin's R render options. Search for the "zeppelin.R.render.options" key and add "dpi=300":
"zeppelin.R.render.options": "out.format = 'html', comment = NA, echo = FALSE, results = 'asis', message = F, warning = F, dpi=300",
You can see an example of the output below:
Created on 08-25-2017 05:25 AM - edited 08-17-2019 05:16 PM
- Mark as New
- Bookmark
- Subscribe
- Mute
- Subscribe to RSS Feed
- Permalink
- Report Inappropriate Content
Zeppelin stores a lot of settings in interpreter.json
The default dpi (dots per inch) for R plot is 72, hence the blurry plots. This value can be increased by adding a dpi property to Zeppelin's R render options. Search for the "zeppelin.R.render.options" key and add "dpi=300":
"zeppelin.R.render.options": "out.format = 'html', comment = NA, echo = FALSE, results = 'asis', message = F, warning = F, dpi=300",
You can see an example of the output below:


