
Our Community is getting an upgrade! To get everything ready for the relaunch, we’ll be placing the site in read-only mode starting September 21st.
We really appreciate your understanding while we get things set up behind the scenes. Catch up on all the exciting details about the move here.
Need help or have questions? Drop us a line at [email protected]

Archives of Support Questions (Read Only)
- Cloudera Community
- Board Archive
- Archives of Support Questions (Read Only)
- YARN Capacity Scheduler Queue utilisation graph.
- Subscribe to RSS Feed
- Mark Question as New
- Mark Question as Read
- Float this Question for Current User
- Bookmark
- Subscribe
- Mute
- Printer Friendly Page
- Subscribe to RSS Feed
- Mark Question as New
- Mark Question as Read
- Float this Question for Current User
- Bookmark
- Subscribe
- Mute
- Printer Friendly Page
YARN Capacity Scheduler Queue utilisation graph.
- Labels:
-
Apache YARN


Created 12-09-2015 02:38 PM
- Mark as New
- Bookmark
- Subscribe
- Mute
- Subscribe to RSS Feed
- Permalink
- Report Inappropriate Content
Is there any tool which will give Queue utilisation(memory, cores) graph?
I want historical data in graphical representation, so that I can adjust my workload(reschedule jobs) as per resource utilization trend over time.


Created on 12-16-2015 04:42 AM - edited 08-19-2019 05:43 AM
- Mark as New
- Bookmark
- Subscribe
- Mute
- Subscribe to RSS Feed
- Permalink
- Report Inappropriate Content
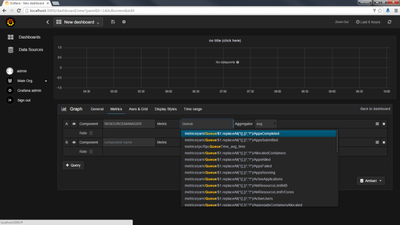
I guess Grafana with Ambari can help on this. Please use link to setup and configure Grafana.
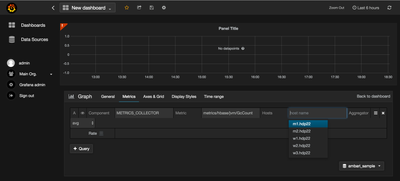
Once Grafana is accessible, design your dashboard. Below are few sample screenshots:

Created 02-10-2016 12:59 PM
- Mark as New
- Bookmark
- Subscribe
- Mute
- Subscribe to RSS Feed
- Permalink
- Report Inappropriate Content


Created on 02-10-2016 01:04 PM - edited 08-19-2019 05:42 AM
- Mark as New
- Bookmark
- Subscribe
- Mute
- Subscribe to RSS Feed
- Permalink
- Report Inappropriate Content

Created 02-10-2016 01:16 PM
- Mark as New
- Bookmark
- Subscribe
- Mute
- Subscribe to RSS Feed
- Permalink
- Report Inappropriate Content
What is your ambari and HDP version. Try generating graph for some other component like Resourcemanager. Also try deleting stale hosts/services from ambari.
Created on 02-10-2016 01:44 PM - edited 08-19-2019 05:42 AM
- Mark as New
- Bookmark
- Subscribe
- Mute
- Subscribe to RSS Feed
- Permalink
- Report Inappropriate Content
I have ambari Version2.2.0.0 and hdp stack 2.3.4.0.
I tried for other metrics for Resourcemanager but getting some weird error.
Problem! Unable to compile query predicate: Invalid Query Token: token='(', previous token type=VALUE_OPERAND.

Created 02-11-2016 02:14 PM
- Mark as New
- Bookmark
- Subscribe
- Mute
- Subscribe to RSS Feed
- Permalink
- Report Inappropriate Content
Metrics for which you are trying to generate the graph needs to be edited manually.
Enter "metrics/yarn/Queue/root/AvailableMB" in metric box while selecting Resourcemanager
Similarly for child queue of root viz child1 you have to enter metrics/yarn/Queue/root/child1/AvailableMB
I have tested this on ambari Version 2.2.0.0 with hdp stack 2.3.4.0.

- « Previous
-
- 1
- 2
- Next »

