
Our Community is getting an upgrade! To get everything ready for the relaunch, we’ll be placing the site in read-only mode starting September 21st.
We really appreciate your understanding while we get things set up behind the scenes. Catch up on all the exciting details about the move here.
Need help or have questions? Drop us a line at [email protected]

Archives of Support Questions (Read Only)
- Cloudera Community
- Board Archive
- Archives of Support Questions (Read Only)
- Re: ambari rest api for metrics
- Subscribe to RSS Feed
- Mark Question as New
- Mark Question as Read
- Float this Question for Current User
- Bookmark
- Subscribe
- Mute
- Printer Friendly Page
- Subscribe to RSS Feed
- Mark Question as New
- Mark Question as Read
- Float this Question for Current User
- Bookmark
- Subscribe
- Mute
- Printer Friendly Page
ambari rest api for metrics
- Labels:
-
Apache Ambari


Created 02-20-2018 06:54 AM
- Mark as New
- Bookmark
- Subscribe
- Mute
- Subscribe to RSS Feed
- Permalink
- Report Inappropriate Content
Is there rest api which can fetch all the details what metrics monitors collects or metrics collector does ?
Thanks in advance



Created 02-20-2018 07:11 AM
- Mark as New
- Bookmark
- Subscribe
- Mute
- Subscribe to RSS Feed
- Permalink
- Report Inappropriate Content
However one thing you can try:
You can make the following API call to query individual Host metrics for a specific time range.
example:
# curl -v "http://amb25102.example.com:6188/ws/v1/timeline/metrics?metricNames=bytes_in._rate._avg&hostname=&appId=HOST&instanceId=&startTime=1451630974&endTime=1519110315"
.
However in this case you will need to keep changing the metrics name like "byte_in" ....
The time range you can take longer like "1451630974" means starting from 1 Jan 2016 , till "1519110315" means now.
NOTE: However as mentioned earlier there is no Single API call that can be used to fetch all the AMS collector data.
Created 02-20-2018 07:02 AM
- Mark as New
- Bookmark
- Subscribe
- Mute
- Subscribe to RSS Feed
- Permalink
- Report Inappropriate Content
There is not Rest API call which can be used to capture the whole Metrics Monitors/Collectors Data in form of a file.
However you can query these data from the AMS collector Hbase database using utilities like sqlline as desceribed in
As mentioned on the other thread: https://community.hortonworks.com/questions/172151/data-source-for-ambari-metrics-collector.html?chi...
Created 02-20-2018 07:10 AM
- Mark as New
- Bookmark
- Subscribe
- Mute
- Subscribe to RSS Feed
- Permalink
- Report Inappropriate Content
is there some way I can get data what metrics monitor collect system-level metrics and publish to the Metrics Collector.
other than using sqlline .
where does metrics monitor collects system level metrics ?
Created on 02-20-2018 07:16 AM - edited 08-17-2019 06:05 PM
- Mark as New
- Bookmark
- Subscribe
- Mute
- Subscribe to RSS Feed
- Permalink
- Report Inappropriate Content
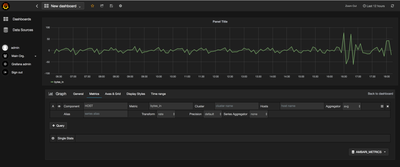
You can use Grafana to get the Host Level metrics which are sent by Ambari Metrics Monitor to Ambari Metrics Collector, By creating a custom dashboard. (Still it will be in form of Graph and not a single file with whole data)
Like: In following case i created a New Dashboard with "HOST" metrics and the metrics name is "byte_in" with Aggregator as "avg"
Created 02-20-2018 07:11 AM
- Mark as New
- Bookmark
- Subscribe
- Mute
- Subscribe to RSS Feed
- Permalink
- Report Inappropriate Content
However one thing you can try:
You can make the following API call to query individual Host metrics for a specific time range.
example:
# curl -v "http://amb25102.example.com:6188/ws/v1/timeline/metrics?metricNames=bytes_in._rate._avg&hostname=&appId=HOST&instanceId=&startTime=1451630974&endTime=1519110315"
.
However in this case you will need to keep changing the metrics name like "byte_in" ....
The time range you can take longer like "1451630974" means starting from 1 Jan 2016 , till "1519110315" means now.
NOTE: However as mentioned earlier there is no Single API call that can be used to fetch all the AMS collector data.
Created 02-20-2018 07:15 AM
- Mark as New
- Bookmark
- Subscribe
- Mute
- Subscribe to RSS Feed
- Permalink
- Report Inappropriate Content
can you please brief about all metricsNames AMS has or location for the same where I can check ?
Created 02-20-2018 07:19 AM
- Mark as New
- Bookmark
- Subscribe
- Mute
- Subscribe to RSS Feed
- Permalink
- Report Inappropriate Content
Some of the metrics list you can find here that are exposed to the AMS collector:
For All kind of metrics:
.
For particularly host specific metrics names you can refer to:
Created 02-21-2018 07:56 AM
- Mark as New
- Bookmark
- Subscribe
- Mute
- Subscribe to RSS Feed
- Permalink
- Report Inappropriate Content
Hi Jay,
curl -v "http://amb25102.example.com:6188/ws/v1/timeline/metrics?metricNames=bytes_in._rate._avg&hostname=&appId=HOST&instanceId=&startTime=1451630974&endTime=1519110315"
This rest api not working for For All kind of metrics:.
I have replaced bytes_in._rate._avg to master.Server.numDeadRegionServers
curl -v "http://amb25102.example.com:6188/ws/v1/timeline/metrics?metricNames=master.Server.numDeadRegionServers&hostname=&appId=HOST&instanceId=&startTime=1451630974&endTime=1519110315"
but not able to get the metrics results .


