
Our Community is getting an upgrade! To get everything ready for the relaunch, we’ll be placing the site in read-only mode starting September 21st.
We really appreciate your understanding while we get things set up behind the scenes. Catch up on all the exciting details about the move here.
Need help or have questions? Drop us a line at [email protected]

Archives of Support Questions (Read Only)
- Cloudera Community
- Board Archive
- Archives of Support Questions (Read Only)
- Re: how to change the in,out,read/write time in Ap...
- Subscribe to RSS Feed
- Mark Question as New
- Mark Question as Read
- Float this Question for Current User
- Bookmark
- Subscribe
- Mute
- Printer Friendly Page
- Subscribe to RSS Feed
- Mark Question as New
- Mark Question as Read
- Float this Question for Current User
- Bookmark
- Subscribe
- Mute
- Printer Friendly Page
how to change the in,out,read/write time in Apache NIFI?
- Labels:
-
Apache NiFi


Created on 09-14-2017 01:25 PM - edited 08-18-2019 01:33 AM
- Mark as New
- Bookmark
- Subscribe
- Mute
- Subscribe to RSS Feed
- Permalink
- Report Inappropriate Content
Hello,
My NIFI flow is successfully run
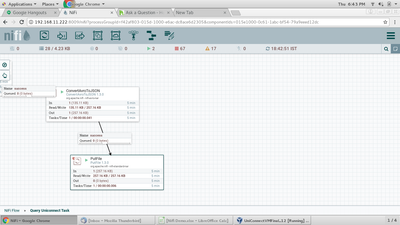
After that I have seen that the In,Read/Write,Out in processor view
But after 5 min the all information is flush from processor view
I check the processor code, there is no code for flush information after 5 min
that is happen in every processor
I have to change that time, how can I do that



Created on 09-14-2017 02:18 PM - edited 08-18-2019 01:33 AM
- Mark as New
- Bookmark
- Subscribe
- Mute
- Subscribe to RSS Feed
- Permalink
- Report Inappropriate Content
There is no way to change the 5 minute running average on the processors.
What are you looking for?
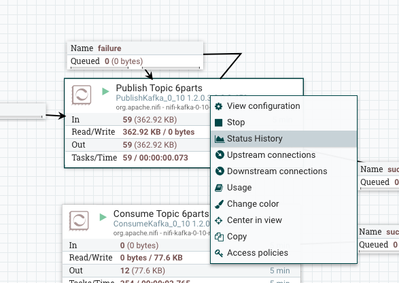
You can still see the stats from the processor by hovering the cursor over the processor and right=click, then a menu pops up and you can see the Status History of the processor:
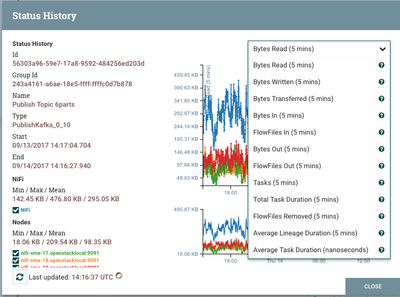
A new window opens with a choice of stats to view


Created 09-14-2017 02:11 PM
- Mark as New
- Bookmark
- Subscribe
- Mute
- Subscribe to RSS Feed
- Permalink
- Report Inappropriate Content
@Mitthu Wagh the 5-minute window is not currently configurable. However, NiFi does take a snapshot of these values (and several others) every 1 minute (by default) and when you right-click on a Processor, you can go to Status History. This will graph that value over time. By default it will grab those 5-minute statistics every minute for 24 hours. This can be changed by updating the "nifi.components.status.repository.buffer.size" and "nifi.components.status.snapshot.frequency" properties in nifi.properties. You could also get these values via a Reporting Task if you wanted to push them somewhere else such as Grafana for longer-term storage.
Created on 09-14-2017 02:18 PM - edited 08-18-2019 01:33 AM
- Mark as New
- Bookmark
- Subscribe
- Mute
- Subscribe to RSS Feed
- Permalink
- Report Inappropriate Content
There is no way to change the 5 minute running average on the processors.
What are you looking for?
You can still see the stats from the processor by hovering the cursor over the processor and right=click, then a menu pops up and you can see the Status History of the processor:
A new window opens with a choice of stats to view


