
Our Community is getting an upgrade! To get everything ready for the relaunch, we’ll be placing the site in read-only mode starting September 21st.
We really appreciate your understanding while we get things set up behind the scenes. Catch up on all the exciting details about the move here.
Need help or have questions? Drop us a line at [email protected]

Archives of Support Questions (Read Only)
- Cloudera Community
- Board Archive
- Archives of Support Questions (Read Only)
- Re: problem with yarn from ambari dashboard
- Subscribe to RSS Feed
- Mark Question as New
- Mark Question as Read
- Float this Question for Current User
- Bookmark
- Subscribe
- Mute
- Printer Friendly Page
- Subscribe to RSS Feed
- Mark Question as New
- Mark Question as Read
- Float this Question for Current User
- Bookmark
- Subscribe
- Mute
- Printer Friendly Page
problem with yarn from ambari dashboard
- Labels:
-
Apache Ambari
-
Apache Hadoop
-
Apache YARN


Created on 10-25-2017 08:05 AM - edited 08-17-2019 06:13 PM
- Mark as New
- Bookmark
- Subscribe
- Mute
- Subscribe to RSS Feed
- Permalink
- Report Inappropriate Content
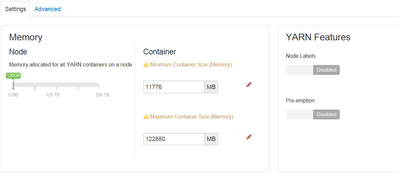
what could be the reason that yarn memory is very high?
any suggestion to verify this?
we have this value from ambari
yarn.scheduler.capacity.root.default.user-limit-factor=1
yarn.scheduler.minimum-allocation-mb=11776
yarn.scheduler.maximum-allocation-mb=122880
yarn.nodemanager.resource.memory-mb=120G
 /usr/bin/yarn application -list -appStates RUNNING | grep  RUNNING


  Thrift JDBC/ODBC Server                SPARK          hive         default                 RUNNING               UNDEFINED                  10%
  Thrift JDBC/ODBC Server                SPARK          hive         default                 RUNNING               UNDEFINED                  10%
  mcMFM                                  SPARK          hdfs         default                 RUNNING               UNDEFINED                  10%
  mcMassRepo                             SPARK          hdfs         default                 RUNNING               UNDEFINED                  10%
  mcMassProfiling                        SPARK          hdfs         default                 RUNNING               UNDEFINED


free -g
              total        used        free      shared  buff/cache   available
Mem:             31          24           0           1           6           5
Swap:             7           0           7



Created 10-25-2017 08:41 AM
- Mark as New
- Bookmark
- Subscribe
- Mute
- Subscribe to RSS Feed
- Permalink
- Report Inappropriate Content
If you have not set it on your own then , I guess based on the Stack Advisor script as:
putYarnProperty('yarn.nodemanager.resource.memory-mb', int(round(min(clusterData['containers'] * clusterData['ramPerContainer'], nodemanagerMinRam))))
.
Created 10-25-2017 09:58 AM
- Mark as New
- Bookmark
- Subscribe
- Mute
- Subscribe to RSS Feed
- Permalink
- Report Inappropriate Content
Jay not in this issue , but I will happy to get tour answer about my quastion from - https://community.hortonworks.com/questions/142356/how-to-recover-the-standby-name-node-in-ambari-cl...

- « Previous
-
- 1
- 2
- Next »

