Our Community is getting an upgrade! To get everything ready for the relaunch, we’ll be placing the site in read-only mode starting September 21st. We really appreciate your understanding while we get things set up behind the scenes. Catch up on all the exciting details about the move here. Need help or have questions? Drop us a line at [email protected]
Created on 07-07-201606:04 PM - edited 08-17-201911:32 AM
In HDP 2.5 Sandbox, I did a quick walk through.
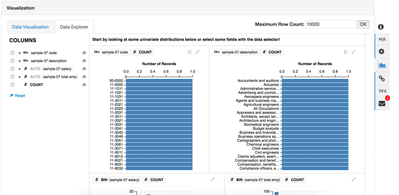
First thing I liked was the Visualization:
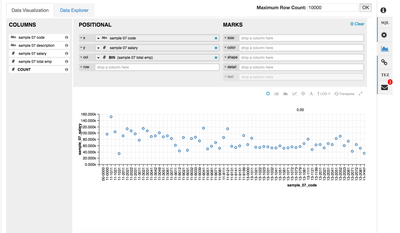
The Data Explorer provided a nice query tool to view tables and graphs.
The Data Visualization tab provides some nice graphing capabilities.
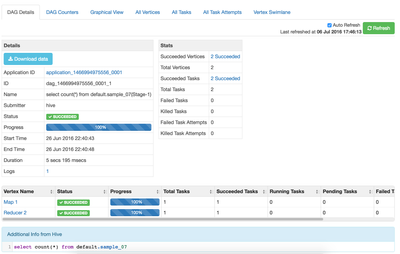
After you run your queries you can look at the Tez results to see how it ran, it's a nice way to see what you may need to optimize.
The Hive Ambari View is getting to be a very solid tool for working with Hive. From DDL (creating tables is easy) to viewing data, to updates and inserts.