Community Articles
- Cloudera Community
- Support
- Community Articles
- Building a Kafka monitoring system with NiFi, Kudu...
- Subscribe to RSS Feed
- Mark as New
- Mark as Read
- Bookmark
- Subscribe
- Printer Friendly Page
- Report Inappropriate Content
- Subscribe to RSS Feed
- Mark as New
- Mark as Read
- Bookmark
- Subscribe
- Printer Friendly Page
- Report Inappropriate Content
Created on 02-02-2021 10:31 PM
Introduction
When running Apache Kafka at scale, sooner or later you will start worrying about available disk space, growth rates of topics, or general disk usage. This is especially the case when handling with external producers - outside of your direct control and without configuring hard size limits within your retention configuration.
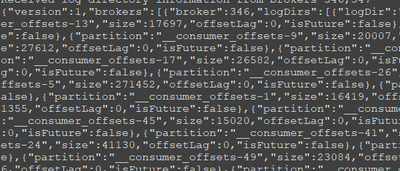
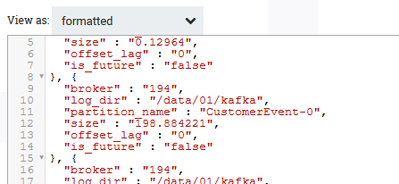
The kafka-log-dirs tool allows you to determine the current size and location of all available partitions on your Kafka cluster. Due to its nature, this tool only represents a snapshot of the current state without any history - and it is far from being convenient to use.
You want to know how far? Here's a snippet of the output:
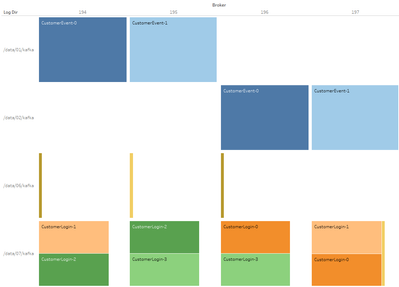
But we want to turn the JSON above into something more shiny and usable, like this:
So, let us figure out how we can facilitate Apache NiFi, Apache Kudu, and Tableau to retrieve consumable visualization and actionable insights about your Kafka cluster!
Architecture
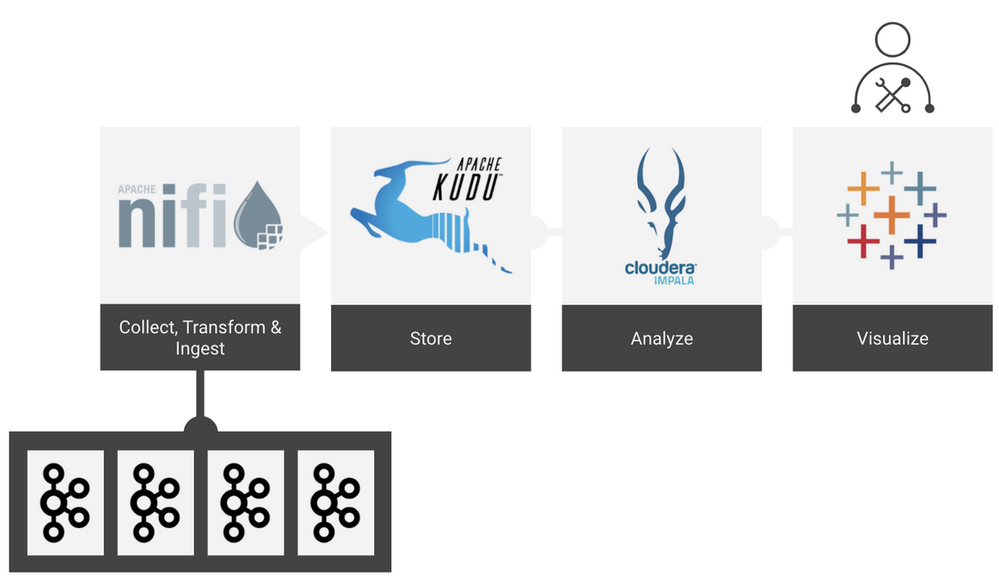
On a high level, we are going to use Apache NiFi to collect, transform and ingest data provided by the kafka-log-dirs tool. We will use Apache Kudu to store, Apache Impala to analyze, and Tableau to visualize it.
Used versions
The entire article uses the mentioned components in the following versions:
- Kafka 2.0
- Nifi 1.9.0
- Kudu 1.8.0
- Impala 3.1.0
- Tableau Desktop 2020.1.7
Create Kudu table
Before we start with any NiFi flow, we first need to make sure that the table, which we will insert into the data from the kafka-log-dirs tool, is available in Kudu and Impala.
We will create the table through Impala by executing the following command:
CREATE TABLE default.monitoring_kafka (
  broker INT,
  log_dir STRING,
  partition_name STRING,
  processed_at_utc TIMESTAMP,
  size DECIMAL(18,6),
  offset_lag INT,
  is_future BOOLEAN,
  PRIMARY KEY (broker, log_dir, partition_name, processed_at_utc)
)
PARTITION BY HASH(broker, log_dir, partition_name) PARTITIONS 4,
RANGE(processed_at_utc)
(
    PARTITION '2020-01-01' <= values < '2020-07-01',
    PARTITION '2020-07-01' <= values < '2021-01-01',
    PARTITION '2021-01-01' <= values < '2021-07-01',
    PARTITION '2021-07-01' <= values < '2022-01-01',
    PARTITION '2022-01-01' <= values < '2022-07-01',
    PARTITION '2022-07-01' <= values < '2023-01-01'
)
STORED AS KUDU
TBLPROPERTIES ('kudu.num_tablet_replicas' = '3',
'kudu.master_addresses' = 'staging-kudu1:7051');
We will use hash partitioning on the columns broker, log_dir, and partition_name combined with range partitioning on the time dimension. Depending on the amount of expected inserted data and the expected query volume while analyzing the data, your partitioning strategy might vary in the number of partitions and in the range per partition.
NiFi
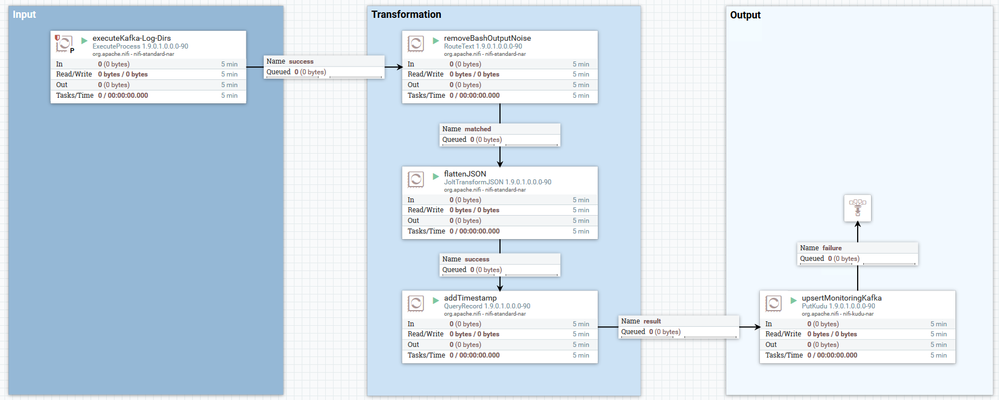
Our NiFi flow is split into 3 parts:
- Input: Acquire data about the current partition sizes with the kafka-log-dirs tool
- Transformation: The purpose is to clean and transform the input data into a record-based format that allows an easy upsert operation in Kudu. This is done in three simple steps:
- Removing bash noise
- Flatten JSON (the actual data we're interested in)
- add now() timestamp
- Output: upsert rows into Kudu
For the sake of simplicity, we will not focus on any failure handling here. Failure paths are either auto-terminated or will end in a funnel.
Execute Kafka-Log-Dirs
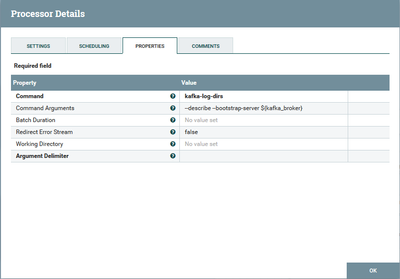
The NiFi processor ExecuteProcess allows you to execute commands on an OS level as if you were using the CLI. The Command property specifies the actual command that you execute. Any arguments go into the Command Arguments property. Both properties support the variable registry that we're going to make use of.
We would like to get the partition size for all existing Kafka topics, therefore we need to execute the following within ExecuteProcessor:
kafka-log-dirs --describe --bootstrap-server <list-of-your-kafka-brokers:port>This command will be split in both mentioned properties as follows:
Command: kafka-log-dirs
Command Arguments:
--describe --bootstrap-server ${kafka_broker}Notice that we are not hardcoding the Kafka bootstrap servers, but retrieving them from the variable registry by accessing a variable called ${kafka_broker}. This is particularly useful when you have multiple NiFi instances where you want to deploy your flow (i.e.: development, staging, production). By utilizing the variable registry we can keep the actual Nifi flow untouched and only have to change the value of the kafka_broker variable (assuming that there are also different Kafka brokers used in the development, staging, and production environment - which is hopefully the case).
If you like to limit the output to a specific list of topics simply add the argument --topic-list followed by a comma-separated list of your topics to the Command Arguments property:
--topic-list <myTopic1>,<myTopic2>
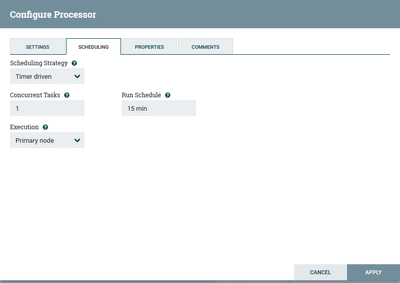
Ensure executing this processor on the primary node only. Otherwise, each node will execute the kafka-log-dirs tool and forward the result to the adjacent processor that will lead to duplicates. For now, we will execute the processor every 15 minutes. Feel free to change the scheduling according to your needs.
Here's the output of our processor:
Remove Bash Output Noise
The kafka-log-dirs tool does not only output the partition sizes within a JSON array, but also some logging information as seen above. But since we are only interested in the JSON and the actual information it carries, we can take advantage of the fact that the noise and the actual JSON are nicely separated in different rows. So we can use the RouteText processor to remove the noise.
If you follow the below configuration, this processor will discard all rows that do not start with "{". All matched rows are forwarded to the valid_json path.
Note: This is just one approach, there might be better ways.
Here's the output of our processor:
Flatten JSON
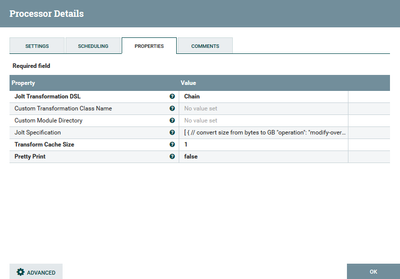
This is where the magic happens. Now that we have the nested JSON output available, we need to squeeze it into a flat format. The JoltTransformJSON processor is the tool of our choice for this use case. Additionally, we will convert the partition size from bytes into GB for easier usability within Tableau. Simply because 237.98 GB is easier to read and interpret than 237898518923 bytes.
Here's the whole Jolt transformation that we will apply to the incoming JSON:
[
  { // convert size from bytes to GB
    "operation": "modify-overwrite-beta",
    "spec": {
      "brokers": {
        "*": {
          "logDirs": {
            "*": {
              "partitions": {
                "*": {
                  "size": "=divideAndRound(6,@(1,size),1073741824)"
                }
              }
            }
          }
        }
      }
    }
  },
  { // extract all values in independent arrays
    // e.g. "log_dir" : [ "/data/01", "/data/02"],
    // "partition_name" : [ "CustomerEvent-0", "CustomerTransaction-1"],
    // "size" : [ 0.009356, 0.042702 ],
    "operation": "shift",
    "spec": {
      "brokers": {
        "*": {
          "logDirs": {
            "*": {
              "partitions": {
                "*": {
                  "partition": "partition_name[]",
                  "size": "size[]",
                  "offsetLag": "offset_lag[]",
                  "isFuture": "is_future[]",
                  "@(4,broker)": "broker[]",
                  "@(2,logDir)": "log_dir[]"
                }
              }
            }
          }
        }
      }
    }
  },
  { // transpose/pivot/merge/younameit the individual arrays into separate arrays, 1 array per partition
    "operation": "shift",
    "spec": {
      "broker": {
        "*": {
          "*": {
            "$": "[&2].broker"
          }
        }
      },
      "log_dir": {
        "*": {
          "*": {
            "$": "[&2].log_dir"
          }
        }
      },
      "partition_name": {
        "*": {
          "*": {
            "$": "[&2].partition_name"
          }
        }
      },
      "size": {
        "*": {
          "*": {
            "$": "[&2].size"
          }
        }
      },
      "offset_lag": {
        "*": {
          "*": {
            "$": "[&2].offset_lag"
          }
        }
      },
      "is_future": {
        "*": {
          "*": {
            "$": "[&2].is_future"
          }
        }
      }
    }
  }
]
Here's the output of our processor:
Add Timestamp
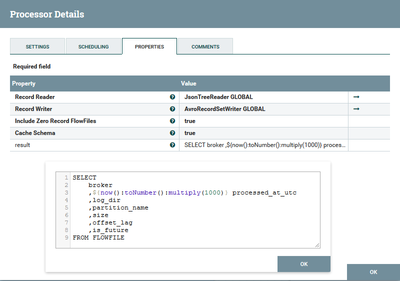
Unfortunately, the kafka-log-dirs tool does not provide any information on what time and date the output data apply to. If you take a look at the JSON without any further context, you would not know if you are looking at the partition size from today, last week, or even last year. Therefore, we will just add a timestamp to the flow file when it is being processed. There are multiple ways of doing this, but for now, we'll use the QueryRecord processor and the Nifi Expression Language to fulfill this requirement.
Following NiFi expression returns the current timestamp in a microseconds epoch (since the Kudu column data type is unixtime_micros)
${now():toNumber():multiply(1000)}This Nifi expression can be directly used in the SQL statement for the processor:
SELECT
    broker
    ,${now():toNumber():multiply(1000)} processed_at_utc
    ,log_dir
    ,partition_name
    ,size
    ,offset_lag
    ,is_future
FROM FLOWFILE
Add a new property, name it result and add the SQL statement. The property result is the name of the relationship to which all FlowFiles are sent after applying the provided SQL statement.
Record Reader: JsonTreeReader (since the incoming data, provided by the Jolt transformation, is of JSON format)
Record Writer: AvroRecordSetWriter (we try to use Avro wherever it makes sense and is applicable. JsonRecordSetWriter would theoretically also work in this scenario)
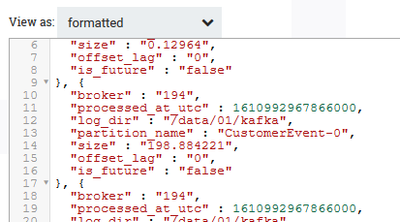
Here's the output of our processor:
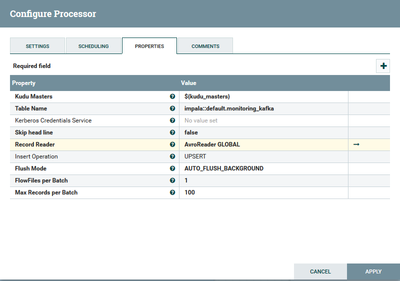
Upsert to Kudu
Now that we have the final record-based data available, we can directly upsert it into our Kudu table by using the PutKudu processor. Again, we do not hardcode server names in the Kudu Masters property due to having multiple environments. We rather use a NiFi variable ${kudu_masters} that stores the string of all Kudu masters depending on which environment we are setting up the flow (same situation as in the Execute Kafka-Log-Dirs section).
Table Name: impala::default.monitoring_kafka (notice the "impala::" prefix because the Kudu table was created through Impala)
Insert Operation: UPSERT (We got used to the flexibility and power of the upsert command that it became our default insert operation in many use cases.
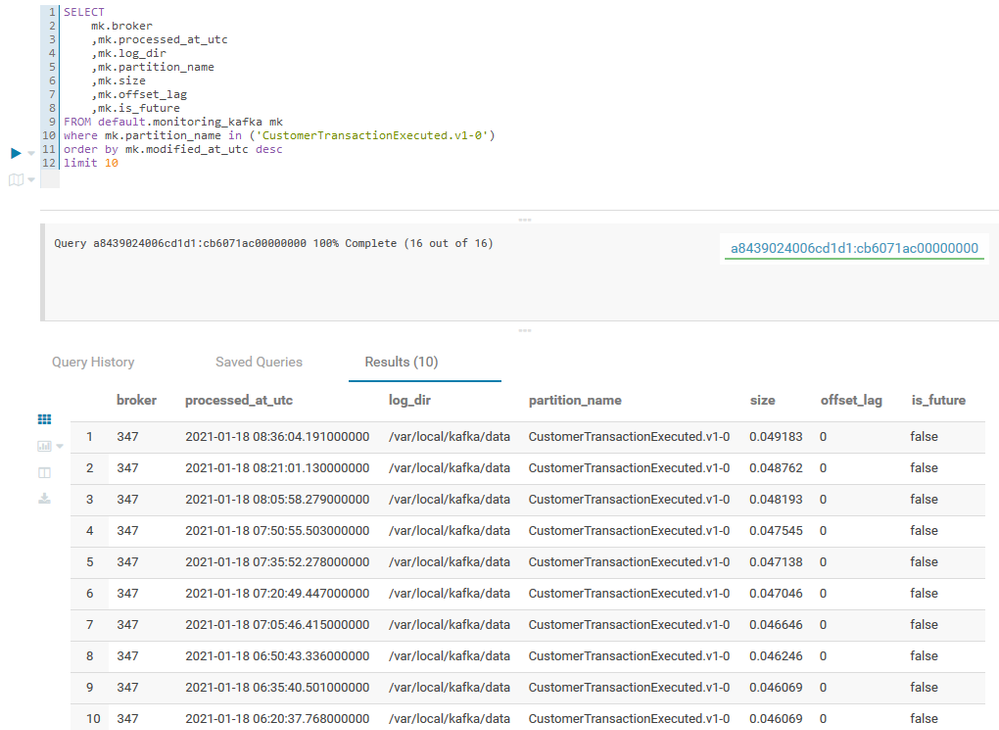
After starting all Nifi processors, we can check the output of our Nifi flow by querying the Kudu table through Impala (and Hue):
Tableau
Now it is time to make some actual use of the kafka-log-dirs tool by analyzing the provided data. With the help of Tableau, we would like to answer two questions:
- Which Kafka partitions are the biggest in my cluster and how are they distributed across nodes and disks?
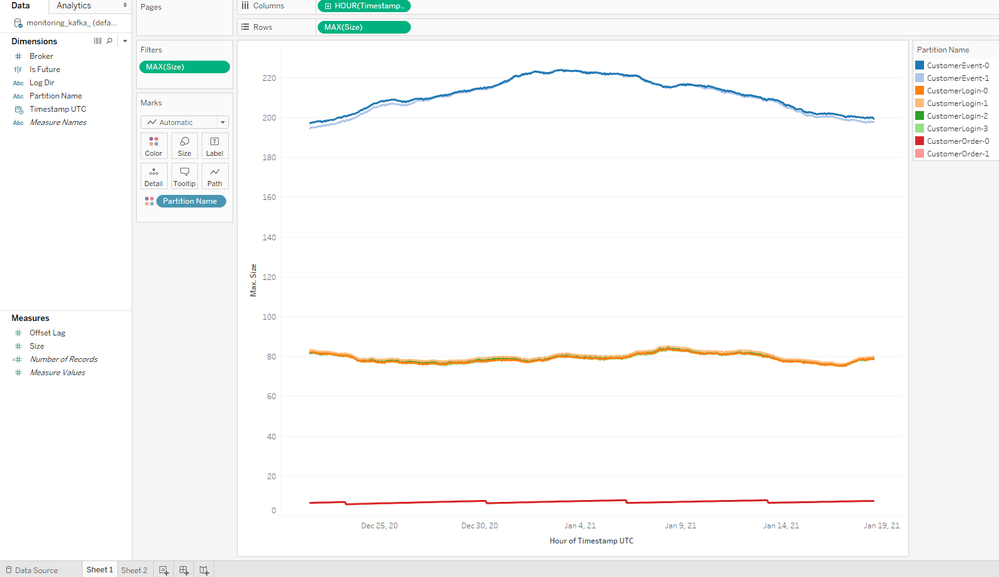
- How does the partition size evolve over time?
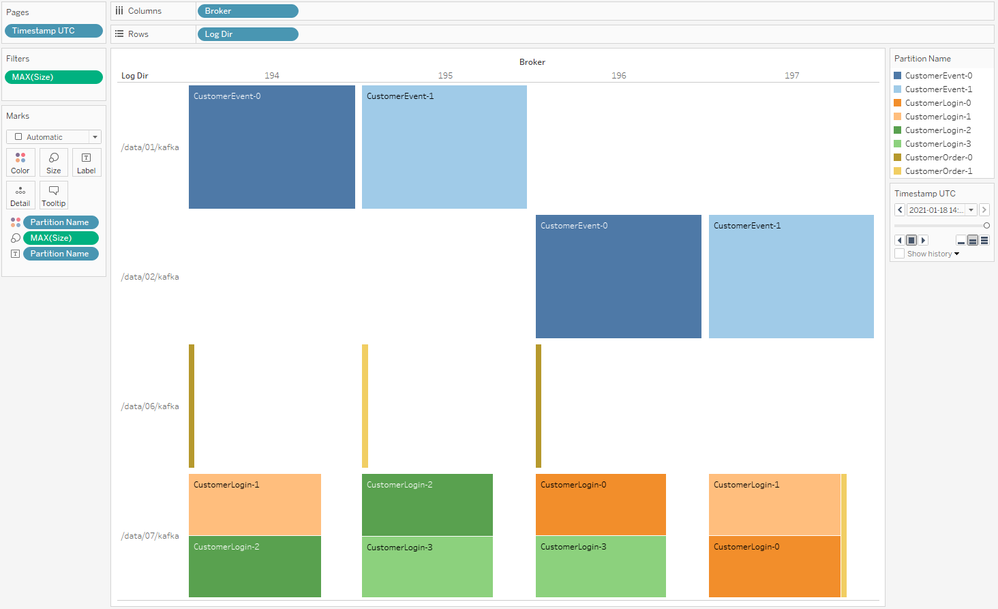
Answering each question requires a different visualization. The first one can be nicely shown in the form of a heat map where each Kafka broker is shown in the columns and each disk (log_dir) is displayed in the rows. The size of the partition will be represented by the color and size of the block. The second question is basically a time series in the form of a line chart with the size of the partition on the Y-axis and time on the X-axis.
Connect to Impala
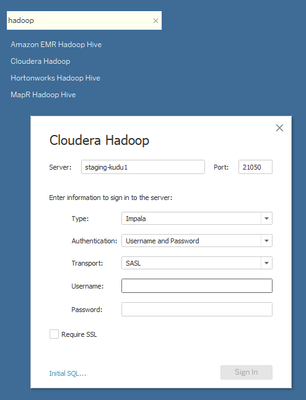
Before we can visualize anything, we need to connect to our table. Conveniently, Tableau is able to connect to Cloudera (Impala and Hive2) out of the box. Just select Cloudera Hadoop and enter the server, port, and select Impala. Enter the corresponding security settings according to your setup (Kerberos, LDAP, no authentication).
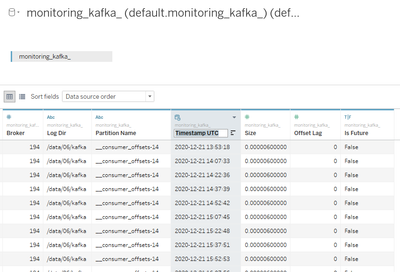
In the next screen, select the right schema (default) and drag & drop the table monitoring_kafka. Make sure the data types are correctly interpreted by Tableau and adjust them if need be. Here you can also rename the columns for easier use in your visualizations. In our example, we will rename Processed At Utc to Timestamp UTC.
Now head over to the worksheet section.
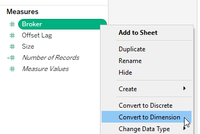
Before we can finally start, we have to fix one small issue. Since column broker is of type INTEGER, Tableau interprets it as a metric, although the broker is a dimension for us. We do not want to sum up broker IDs; we want to split data across broker IDs.
Just right-click Broker and convert it to a dimension:
Kafka Partition Size Time Series
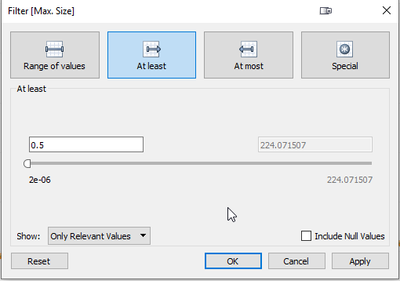
Now drag Timestamp UTC into Columns, drag Size into Rows (choose MAX as a measure) and drag Partition Name onto Color. Additionally, you can add a filter based on MAX(Size). In the example below, this filter is set to at least 0.5, which means that all partitions that are lower than 0.5GB in max(size) will be filtered out. This means that all small topics, like the Kafka internal offset topics, are excluded from the chart.
And here is our final time series chart which shows the evolution of our Kafka partitions over time. If this chart identifies a topic that is continuously growing over time, you might want to adapt the retention strategy for that topic, like lowering the time retention (retention.ms) or applying fixed size retention (retention.bytes).
Kafka Partitions Heat Map
The heat map will show you if your partitions are evenly spread across your brokers and disks, or if you are facing some data skew. First drag and drop Broker into Columns, Log Dir into Rows, Partition Size into Color AND Label, Size into Size (choose MAX as measure) and Timestamp UTC into Pages (applying Timestamp UTC to pages will allow you to jump to any point in time. If you want to have the current state of the heat map, just move the slider [below the Partition Name legend] to the very right or pick the most recent timestamp from the drop down list.)
What insights can you draw from this? The heat map gives you a nifty overview of the actual location of each partition within the cluster. The above example shows that partitions are nicely distributed across the brokers but the disks are not evenly used. /data/06 is only used slightly on broker 194,195 and 196 and it's not used at all on broker 197. On the other hand, there are 2 medium-sized partitions co-located on /data/07 on each broker (shown in green and orange). So one outcome of this visual analysis could be to move one partition from /data/07 to /data/06 on each broker. This could be carried out with the kafka-reassign-partitions tool.
Watch the partitions move, live!
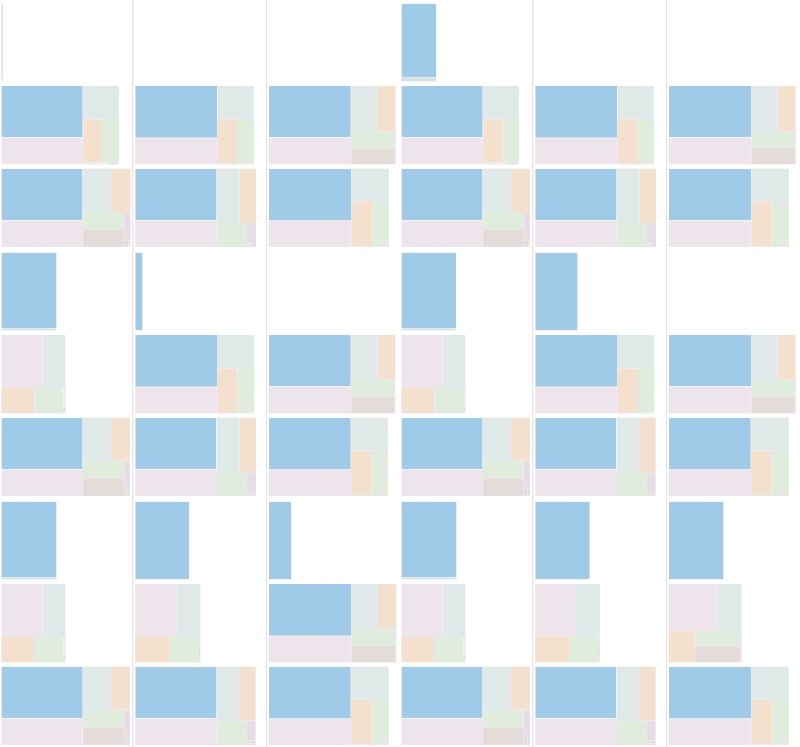
The fancy part is when you actually reassign your Kafka partitions after enabling the monitoring; it allows you to actually watch the kafka-reassign-partitions tool moving partitions from one disk to another. You can reduce the scheduling in the NiFi processor Execute Kafka-Log-Dirs to 1 min or even 30 sec instead of 15 min, which will give you a finer granularity due to a higher data ingest frequency. In the following, you can observe a replay of our latest partition move.
Moving 3 partitions to an empty disk, one partition at a time:
Here you can easily see that Kafka keeps the original partition complete while it mirrors the partition to the other disk. Only after the mirroring is finished the old partition is purged at once.
Summary
Monitoring your Kafka cluster is a crucial part of operating it at scale - actionable insights are the key. The earlier you are able to detect potential deficiencies, the easier the daily life of operators and administrators get. With the help of NiFi, Kudu, and Tableau, monitoring Kafka is easily manageable. While Tableau and Kudu might be swapped with other technologies and tools, NiFi has proven again to be the swiss army knife of arbitrary data integration.
