Community Articles
- Cloudera Community
- Support
- Community Articles
- Cellular IoT Solutions
- Subscribe to RSS Feed
- Mark as New
- Mark as Read
- Bookmark
- Subscribe
- Printer Friendly Page
- Report Inappropriate Content
- Subscribe to RSS Feed
- Mark as New
- Mark as Read
- Bookmark
- Subscribe
- Printer Friendly Page
- Report Inappropriate Content
Created on 11-19-2019 05:37 AM - edited 09-16-2022 01:45 AM

 INTRODUCTION
With IoT growing at an exponential rate it is imperative that we continuously adapt our streaming architectures to stay ahead of the game.
Apache Flink provides many great capabilities for stream processing that can be applied to a modern data architecture to enable advanced stream processing like windowing of streaming data, anomaly detection, and process monitoring to name a few.
Something more important that any one tool; however, is the overall architecture of your solution and how it enables your full data lifecycle.
In order to provide a robust solution you must take into account and make decisions that select the best tools for each part of your data's journey.
Let's look at an example that will be growing rapidly over the next few years. Cellular IoT devices! In particular the IoT devices mad by particle.io.
I will walk you through the end to end solution designed to:
-
Deploy a cellular IoT device at the edge programmed to collect Temperature readings and also accept input to trigger alerts at the edge.
-
Set up web-hook integrations to push your readings into your Enterprise via Apache NiFi.
-
Analyze the readings in flight and route temperature spikes intelligently to alerting flows without delay.
-
Store events in Apache Kafka for downstream consumption in other event driven applications
If you are planning to follow along, code for all stages of the solution can be found on GitHub by following this link: https://github.com/vvagias/IoT_Solutions
You may also find additional tutorials and ask questions here: https:// community.cloudera.com
Let's begin!
DEVICE
DEVICE SELECTION
First we need a device to use at the edge. I will be using a "Particle Electron" shown below.
|
|
|
The device you choose should take into account how it will be deployed and what that environment will offer. For example this device will be used to demonstrate the full solution in several settings and several locations. With no real predictable environment the cellular access combined with the ability to run off a rechargeable battery make this device ideal.
Were this to be deployed here in my office where I am writing this, I could use the exact same architecture but the device I would select would leverage the outlets I have available for power and the local ethernet or WiFi network to communicate.
DEVICE PROGRAMMING
With that said, now that we have selected a device we must provide it with firmware that will allow it to “become” the sensor we need for this solution. As you can see in the image above I have already attached some components. Specifically A DHT11 Temperature and Humidity sensor along with a white and green led. We can add more to this in later advanced sections but for now this will be more than enough.
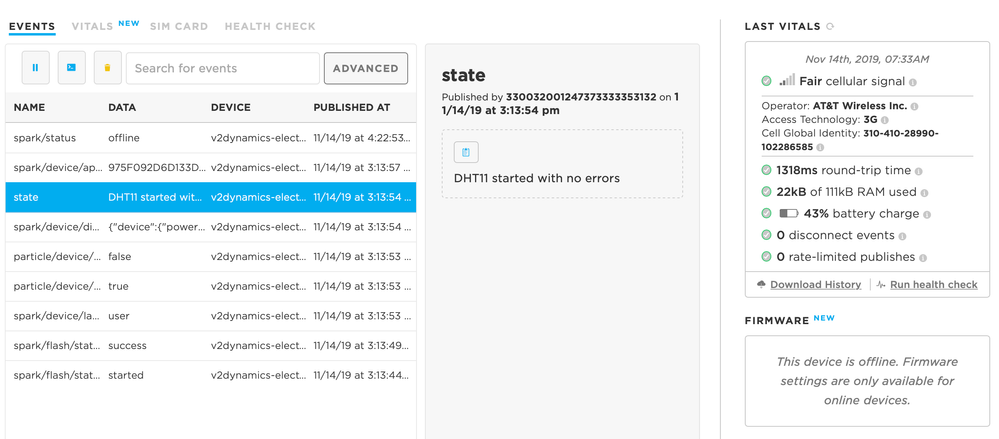
We can see the device and its metrics in the particle console once you have registered it following the instructions included with the device.
To program the device we need an IDE. All devices have IDE’s they work with some have several to choose from.
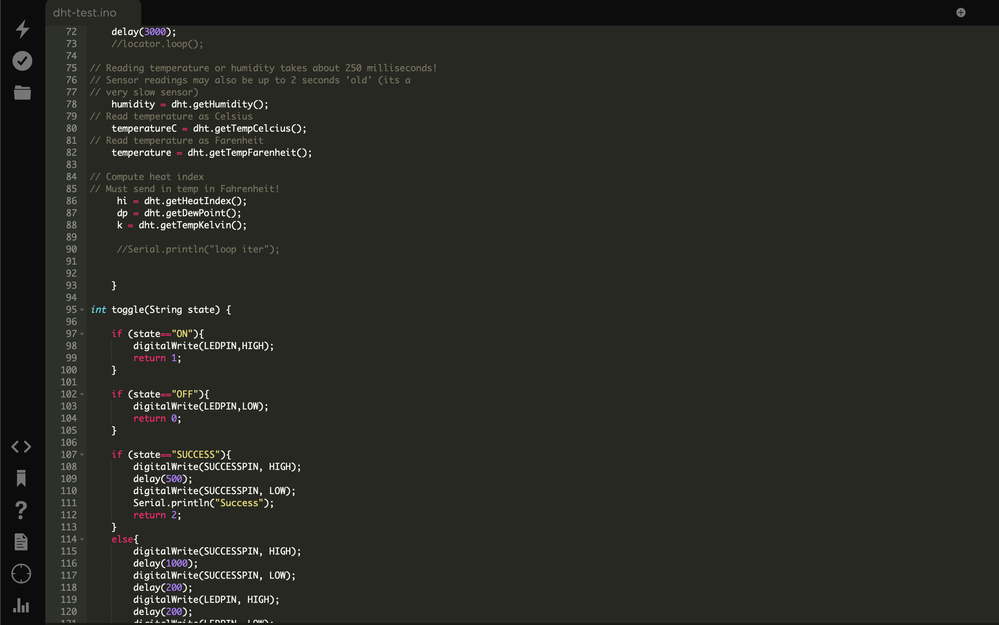
You are free to use any IDE you feel comfortable with. The particle devices have access to an online web IDE which I have found useful as well as IDE plugins for Atom and Visual Studio.
Using the IDE you chose, flash the DHT11 application firmware to your device.
If you're following along then this would be the .ino file from the github repo.
DEVICE TESTING
|
With the firmware flashed you can verify that you are getting readings. Since I chose to use the particle board I am able to call my functions from the console. I can click “GET” on any variable to grab a current reading from the device, or I can call any of the pre-defined functions to execute the code on the device and examine the results. Go ahead and test everything out and once you are satisfied with the functions and variables you have and how they accept and transmit their data you can begin to move on to the next stage in our solution. |
|
DATA INTEGRATION
INTEGRATION POINTS
In an Enterprise setting you don’t always have the luxury of selecting and programming the device/sensor. Often this decision is above your pay-grade or was made by your predecessor and you are now responsible for making those investments work.
This is part of the journey of an IoT developer. In either case there are things we know for certain:
-
Data will be generated by the sensor.
-
That data will have a schema or predictable format.
-
The data needs to be moved into the Enterprise in order to generate value
The variables; however, are what might create issues for you:
-
What format is the data in?
-
How do you access the data?
-
Are there proprietary drivers required?
-
What happens to the data if no one is listening?
-
etc...
As you can see, the devil is always in the details. This is why selecting the right tools for each stage of the solution is a critical point you should take away from this book. Once you become good at a particular tool or programming language it is easy to start seeing it as the solution to every problem. The proverbial person with a hammer hitting in a screw. Sure the hammer can get the screw into the board but then the strengths of both the hammer and the screw have been misused and the connection made by the screw is weaker than if it had been installed using a screw driver. The same is true in every enterprise solution deployment. You should strive to make not only the development of the solution efficient (which is why developers lean towards their strengths in language) but also to maximize the maintainability and future expansion of the solution. If the solution you build is any good it will most certainly drive demand for it’s expansion... You want to be ready and capable when that demand arrises and when opportunities for increased value present themselves.
Far to many organizations struggle trying to manage the mountain of technical debt that they buried their IoT solutions under and end up missing out on opportunities to add new data streams, incorporate ML models and real time analytics or fail to expand to meet the needs of the wider organization.
That’s enough of me trying to caution you as you embark on your journey. Let’s get back to the solution we are examining and look at the integration points.
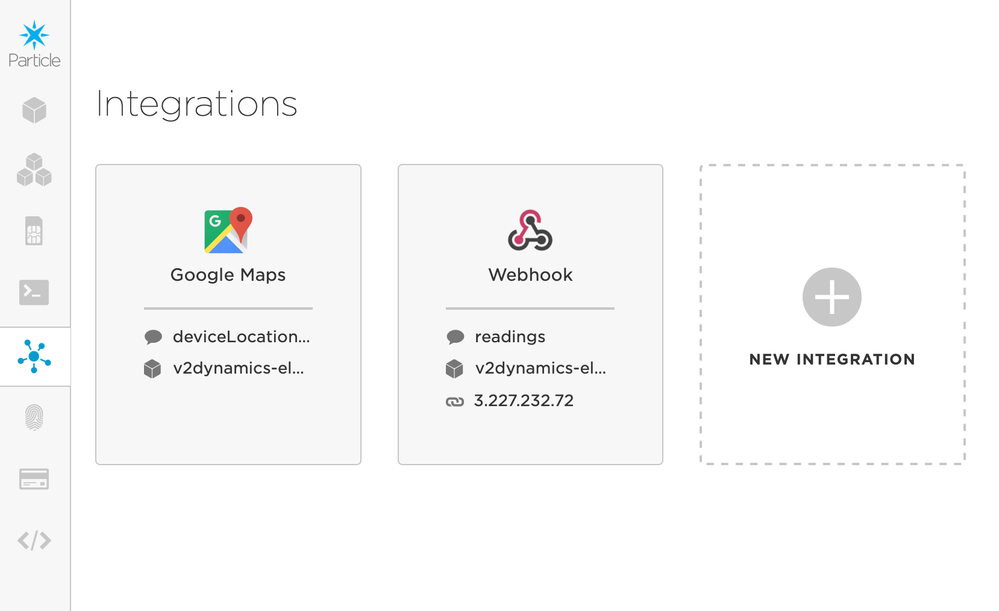
The device we are working with (Particle Electron) leverages a 3G network to communicate and the particle device cloud allows us to set up integrations. For this solution we will leverage a web hook to send a POST request over HTTP anytime the device publishes a temperature reading.
On a side note there are several integration points, all with their own value.
• Direct Serial Port communication
• Request data over HTTP and receive a response
• Pub/Sub to a MQ
• Pub direct to Target Data Store
This is a decision that I made for the elegance and simplicity of being able to change the destination of the web-hook easily and the cluster which processes the data can be created and destroyed at will.
CREATE INTEGRATION
To create the web-hook you simply go to the integrations tab in the Particle console and enter the required info. You should then see it listed as an Integration on the Integration tab. All you need here is the IP address of you ingestion server. We will be using Apache Nifi so we send the data to our NiFi URL.
This takes care of our integration point into the organization. And out sensor is fully operational and ready to be deployed anywhere in the field as is. Great work!
Now to add some color for enterprise deployments. To make this ingest HA you might choose to make the web-hook url endpoint that of a load balancer which would redirect to an active instance of NiFi should you ever have an issue where NiFi goes down you can continue to process the data with a failover instance. You may also choose to add power backup options such as larger batteries, solar or direct outlet to ensure the sensor stays on and requires limited human intervention.
For now we are good with the current setup.
DATA FLOW
INGESTION
With our integration setup we now need to be able to handle the HTTP requests that will be sent to our NiFi instance every time a reading event occurs on our device.
There are countless ways to handle such a request; however, this goes back to picking the right tools for each stage in our process. NiFi was not an arbitrary selection but strategic in the way we are able to handle the ingest, movement and ultimate landing of our data.
To illustrate what I mean let’s look at how easy it is to go from nothing to being able to examine the HTTP request sent by our device.
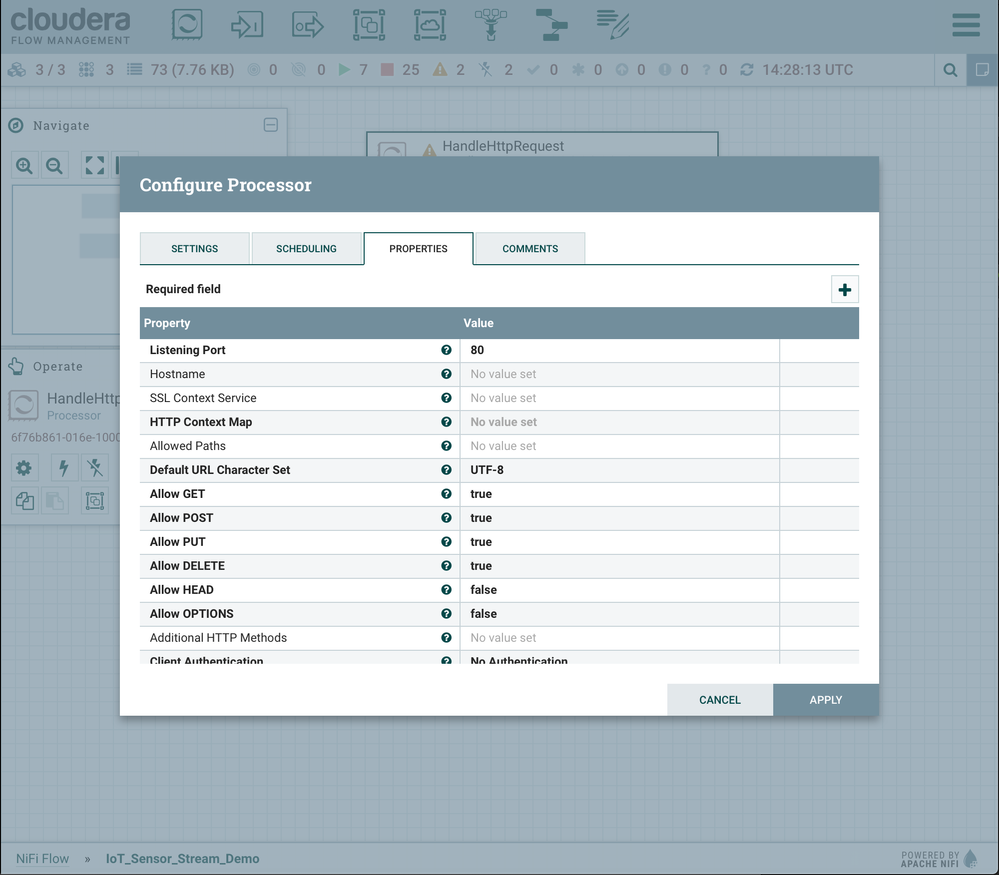
In NiFi the developer can drag a processor onto the canvas and select “HandleHTTPRequest”. Right click and select configure to see the settings view.
As you can see the majority of the properties are pre configured to default values and there are only a few values we need to provide. Namely :
1.Listening Port if different from 80.
2.HTTP Context Map
- This is created for you in the drop down by selecting create new and enabling the service.
3.Any additional values you wish to add in your tailored solution.
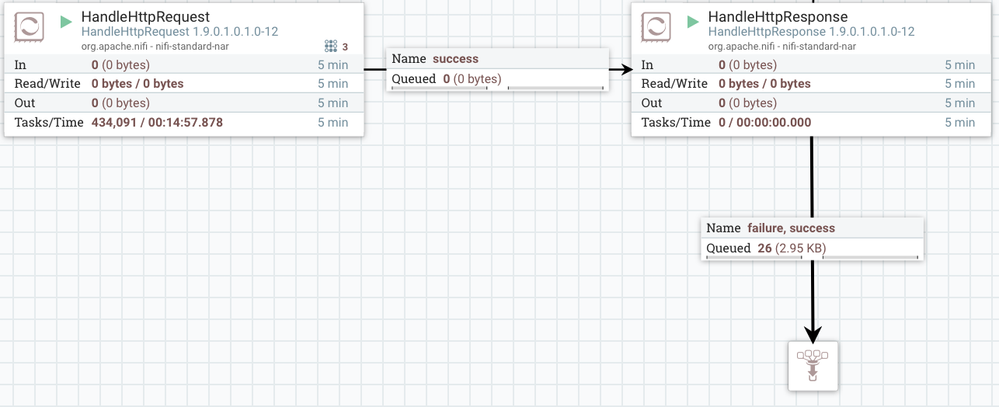
That is all now close the dialogue and drag another processor onto the canvas. This time we use the Handle HTTP Response and specify the return code. Link the two processors together by dragging a connection from Request to Response as seen below:
We also add a “funnel” to direct our messages temporarily as we are developing our flow to allow us to see what our results are.
Now you can go publish some data from the particle console and you will start to see those messages in the Queue in NiFi. That’s all we have a fully functional integration point ready to pull in all messages from our first device and more in the future.
If you are anything like me you have already seen the huge list of processors available in NiFi and no doubt have already tried writing the data to some endpoint or even created a twitter bot by adding another processor to the canvas. This is what I mean when I say efficiency in design, maintainability AND extendability. Completing our original architecture shouldn’t limit us in what else we can enable.
Back to our flow. If you right click the queue and select list queue you see a list of messages. These are flow files and represent each individual event that entered NiFi through your HandleHTTPRequest processor. You can expand a message and click view to see the data you are dealing with:
So our JSON data package will have the following format:
{
"event": "readings",
"data": "69.80",
"published_at": "2019-11-14T15:59:51.534Z", "coreid": "330032001247373333353132"

}
We can always modify the firmware to add additional reading values but this is great for our first phase and 1.0 release.
We now have our ingestion in place and can begin work on the processing of the data.
PROCESSING
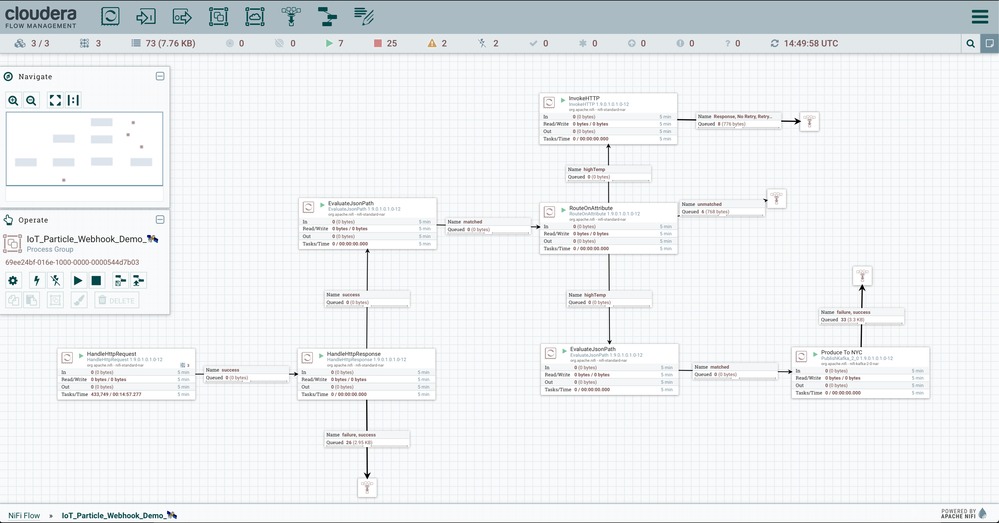
Now let’s add the remaining processors to complete our flow. Add the following processors to the canvas:
1. EvaluateJSONPath x2 2. RouteOnAttribute
3. InvokeHTTP
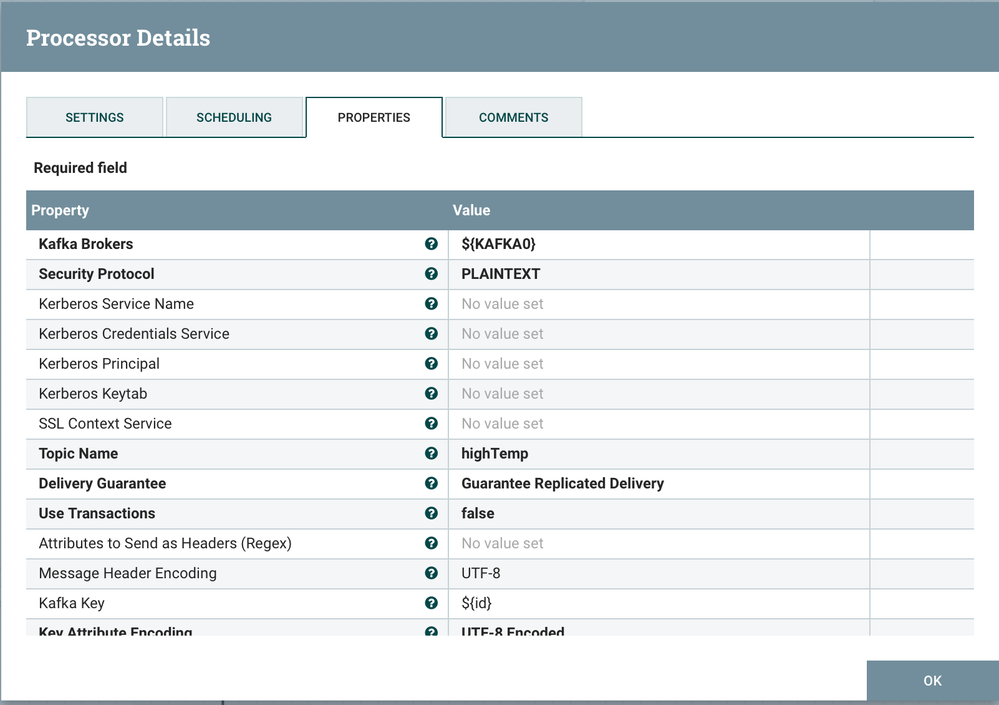
4. PublishKafka_2_0
Now connect them so that the data flows as in the image below:
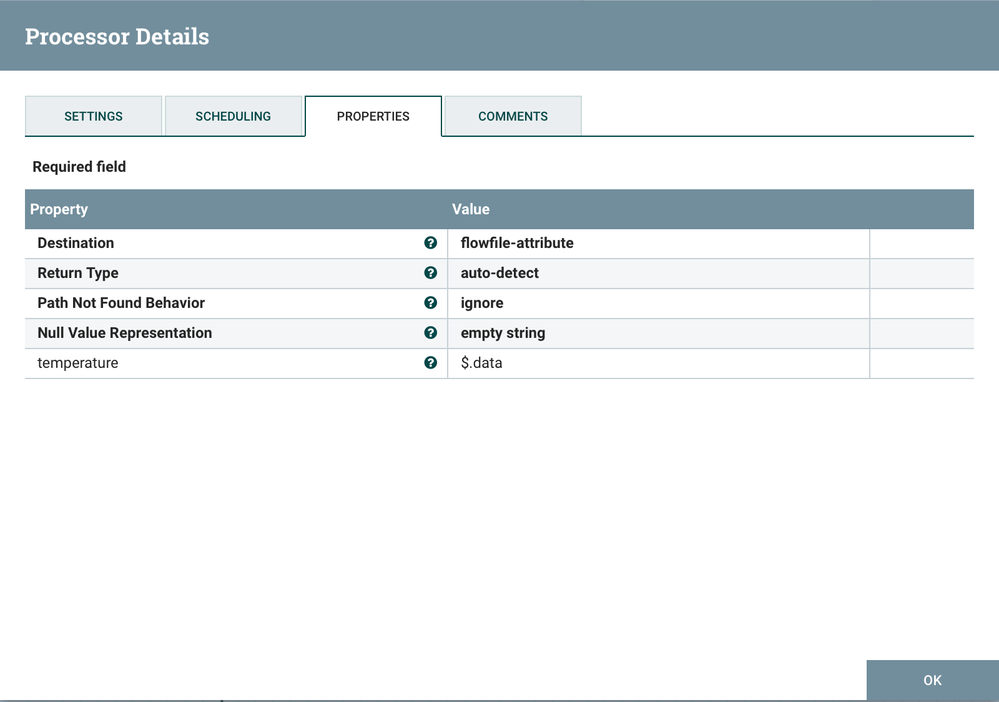
Our first EvaluateJSONPath will simply extract the temperature and store it as an attribute.
[ $.data ] is all we need to enter here that will return the value of the data element that is at the root level of the json.
Now in the RouteOnAttribute processor we can examine this attribute and route to highTemp if it exceeds a certain value. This is where you can begin to translate your business logic into realtime analytics and automate the actions taken to enable a multitude of critical and value driving use cases.
We will be routing our highTemp values immediately to the InvokeHTTP processor which will communicate directly with the device. In our example we will simply toggle an LED to show the functionality, but this is easily expanded to (turn on a pump, turn on an exhaust fan, sound and alarm in multiple places, etc...) Perhaps we simply add it to a more intense monitoring flow that looks at the readings over a given window and only takes action if the trend continues.
There are many more processors you can explore that help you further process and enrich the data as it is in flight. We can now move to the real time action on the data.
REALTIME ACTION
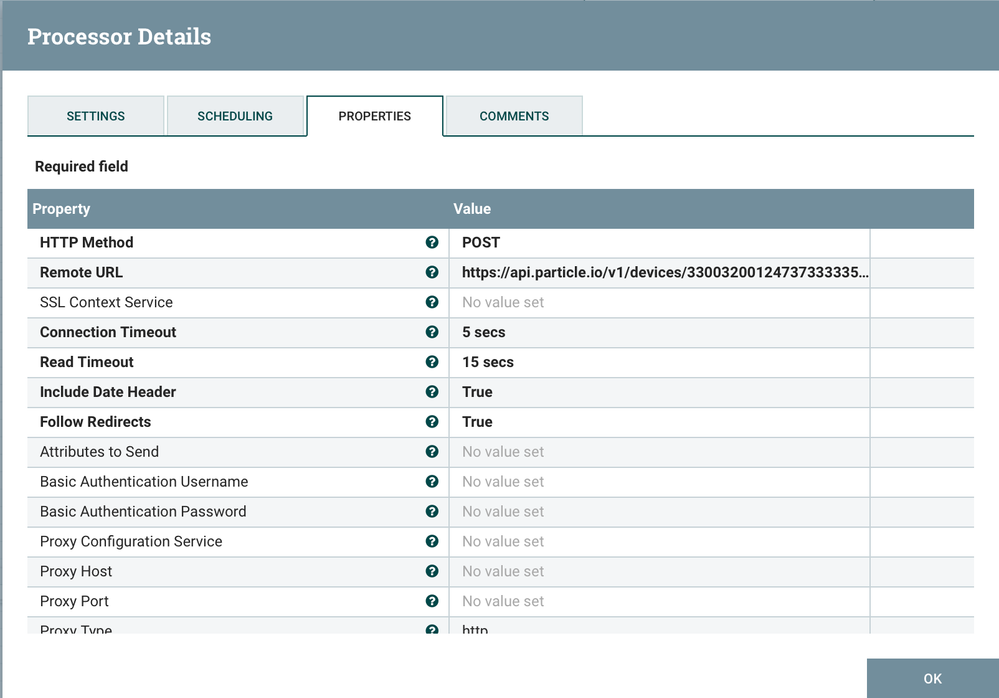
Here we will set our InvokeHTTP processor to the device endpoint. This allows us to communicate directly with the device and (retrieve variable values, execute functions, trigger events, etc...).
We will use the toggle() function we flashed in the firmware to blink our LED when the temperature is above 62° F feel free to change this to a value that is interesting in your environment.
Further down our flow we also push our event data into a Kafka Topic which allows us to decouple our ingest and realtime action portion of the solution from additional downstream applications and storage that depend on this data.
DECOUPLING
In our PublishKafka processor we can specify the Kafka broker and topic we wish to write to. That is all you need to do! Much simpler than having to write java code every time you want to push new data into Kafka, or switch topics...
You may have noticed several PublishKafka processors. There are many available and you can do even more with the others. PublishKafkaRecord allows you to convert formats and publish to Kafka all in a single processor by setting one more property value! Try converting your JSON to Avro for example if you are interested in exploring this further.
We will leave it at that as this checks all our phase 1 boxes and completes the final portion of our solution.
This is the end to end solution as is and takes us from the edge device, through the ingestion and processing of the real time data, all the way to the AI. In this beginners example we implemented a simple but powerful AI that can monitor and act on a continuous stream of sensor data without ever taking a break. Great work!
You might be left thinking 🤔That’s awesome... but what else can I do. What happens to the data next? I’m glad you asked.
In fact the theme of the second book in this series will expand on this solution architecture to take into consideration things like Stream Message Management, Stream Replication, Security and Governance. We will also explore the downstream application part of the architecture as we look at Apache Flink.
Hope you enjoyed reading this book and the solution we evaluated along the way.

