Community Articles
- Cloudera Community
- Support
- Community Articles
- Enable JMX metrics on hadoop using jmxterm
- Subscribe to RSS Feed
- Mark as New
- Mark as Read
- Bookmark
- Subscribe
- Printer Friendly Page
- Report Inappropriate Content
- Subscribe to RSS Feed
- Mark as New
- Mark as Read
- Bookmark
- Subscribe
- Printer Friendly Page
- Report Inappropriate Content
Created on 10-12-2016 04:43 PM - edited 08-17-2019 08:53 AM
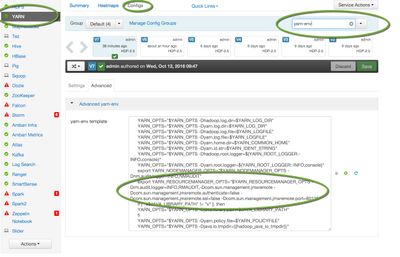
To start pulling jmx metrics from hadoop you need to first enable it via jvm parameters. Go to ambari-->Yarn-->config-->yarn-env
Enable jmx by adding the following params to YARN_RESOURCEMANAGER_OPTS
"-Dcom.sun.management.jmxremote -Dcom.sun.management.jmxremote.authenticate=false -Dcom.sun.management.jmxremote.ssl=false -Dcom.sun.management.jmxremote.port=8001"
Set the port to whatever port is available on your cluster
Save the new config. This will require restart of yarn.
Now you have jmx enabled but you need to client to start pulling jmx metrics. Go to your data node and and download (from here http://wiki.cyclopsgroup.org/jmxterm/download.html) the latest jxmterm-xxx-xxx-uber.jar. For this article I use jmxterm-1.0-alpha-4-uber.jar
Once you have the jmxterm client downloaded lets connect to jxm using
java -jar jmxterm-1.0-alpha-4-uber.jar -l service:jmx:rmi:///jndi/rmi://localhost:<YOURPORT>/jmxrmi
In this example I am set port to 8012.
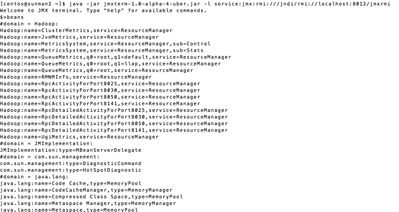
java -jar jmxterm-1.0-alpha-4-uber.jar -l service:jmx:rmi:///jndi/rmi://localhost:8012/jmxrmi
Now I am connected to jxm. Lets look at all the beans available by issuing beans commands
Well now I see all the beans available to pull metrics from. Lets say I want to pull metrics about resourcemanager cluster metrics. That is bean Hadoop:name=ClusterMetrics,service=ResourceManager. Lets find all the attributes available for that beans by issuing info -b Hadoop:name=ClusterMetrics,service=ResourceManager
All the attributes are shown and notice there is a notification attribute. You can use this for notification into your enterprise operational system. To pull metrics for a specific attribute within a bean use
get -b bean_name attribute
For this example I want to know number of active Node Managers which is attribute NumActiveNMs.
get -b Hadoop:name=ClusterMetrics,service=ResourceManager NumActiveNMs
So there are 4 active node managers. I want to know how many node managers are down. That is attribute NumLostNMs
get -b Hadoop:name=ClusterMetrics,service=ResourceManager NumLostNMs
Returns 0 meaning all my node managers are available.
Hope this helps you get started on interacting with JMX.
Created on 10-14-2016 02:41 PM
- Mark as Read
- Mark as New
- Bookmark
- Permalink
- Report Inappropriate Content
Great article. Is there any way to pull individual yarn container JMX? It would be great for me to see what is going on when I start a job and monitor the job containers at real time.
Created on 10-14-2016 02:51 PM
- Mark as Read
- Mark as New
- Bookmark
- Permalink
- Report Inappropriate Content
@ScipioTheYounger most definitely. Simply use exact same process and connect to yarn jvm. you will get all attributes (metrics) available.
Created on 10-17-2016 03:52 AM
- Mark as Read
- Mark as New
- Bookmark
- Permalink
- Report Inappropriate Content
Sunile.
For daemons such as NM and RM, I can hard-code JMS port number. However, how to set different JMX port number on a number of JVM containers running on the same slave node? For example, I can configure 18 container per node, how could I set the port number to 8001-8018? Maybe I can use ZK, or some kind of script.


