Community Articles
- Cloudera Community
- Support
- Community Articles
- HDFS: Track disk consumption by user with Namenode...
- Subscribe to RSS Feed
- Mark as New
- Mark as Read
- Bookmark
- Subscribe
- Printer Friendly Page
- Report Inappropriate Content
- Subscribe to RSS Feed
- Mark as New
- Mark as Read
- Bookmark
- Subscribe
- Printer Friendly Page
- Report Inappropriate Content
Created on
11-25-2019
03:57 AM
- edited on
11-26-2019
08:48 PM
by
ask_bill_brooks
Apache NiFi flow to recursively call the HDFS Namenode WebHDFS API to track disk consumption per user across the cluster for graphing, monitoring, capacity planning and alerting.
It can often times be hard to track the disk consumption per user on your HDFS filesystem. There isn't really a single command to tell you how much disk space a specific user is using across the filesystem (over many directories), nor can you easily track this over time to predict future consumption.
This article attempts to solve both problems. Using a NiFi flow to recursively pull the status of each file stored on HDFS, and storing that in a database for visualising through Superset and/or Grafana.
You can run REST queries against the HDFS active Namenode, and get a listing of all the files and directories at a specific location. Here is an example of query against the Namenode for '/user/willie':
curl -s 'http://localhost:50070/webhdfs/v1/user/willie/?op=liststatus' | python -m json.tool
{
    "FileStatuses": {
        "FileStatus": [
            {
                "accessTime": 1574672355184,
                "blockSize": 134217728,
                "childrenNum": 0,
                "fileId": 34947,
                "group": "willie",
                "length": 2621440000,
                "modificationTime": 1574672392189,
                "owner": "willie",
                "pathSuffix": "bigfile.dat",
                "permission": "644",
                "replication": 1,
                "storagePolicy": 0,
                "type": "FILE"
            },
            {
                "accessTime": 0,
                "blockSize": 0,
                "childrenNum": 4,
                "fileId": 34000,
                "group": "willie",
                "length": 0,
                "modificationTime": 1574612331505,
                "owner": "willie",
                "pathSuffix": "dir1",
                "permission": "755",
                "replication": 0,
                "storagePolicy": 0,
                "type": "DIRECTORY"
            },
            {
                "accessTime": 0,
                "blockSize": 0,
                "childrenNum": 1,
                "fileId": 34001,
                "group": "willie",
                "length": 0,
                "modificationTime": 1574603188421,
                "owner": "willie",
                "pathSuffix": "dir2",
                "permission": "755",
                "replication": 0,
                "storagePolicy": 0,
                "type": "DIRECTORY"
            },
            {
                "accessTime": 0,
                "blockSize": 0,
                "childrenNum": 1,
                "fileId": 34002,
                "group": "willie",
                "length": 0,
                "modificationTime": 1574603197686,
                "owner": "willie",
                "pathSuffix": "dir3",
                "permission": "755",
                "replication": 0,
                "storagePolicy": 0,
                "type": "DIRECTORY"
            }
        ]
    }
}
This is very well documented at: https://hadoop.apache.org/docs/stable/hadoop-project-dist/hadoop-hdfs/WebHDFS.html#List_a_Directory
There are two types of outputs in the sample JSON result, type=FILE and type=DIRECTORY. If type=FILE, then an attribute called length will tell us the filesize, and we know the path this file belongs to, as well as the owner of the file. With this we have enough information to store in a database, and over time we can track the consumption of all the files owned by a specific user.
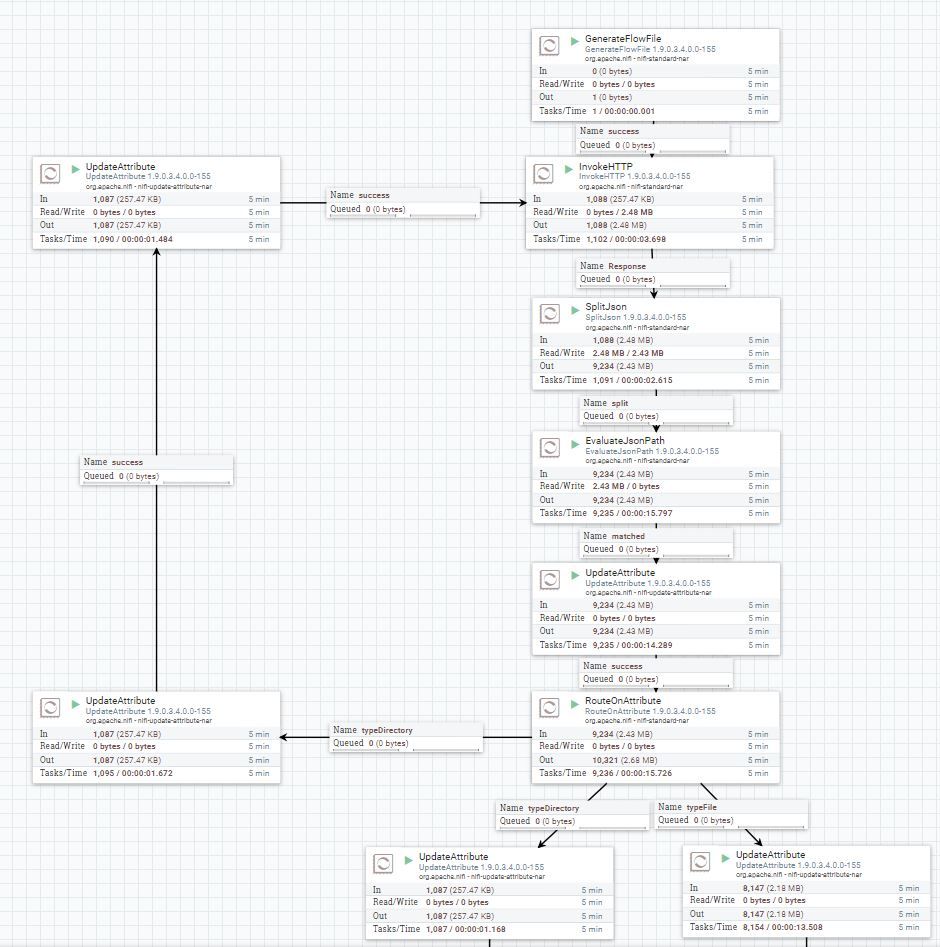
Unfortunately the liststatus API call will only return the results for a specific location. If we want to query a subdirectory (like say /user/willie/dir1), we have to issue another REST API call, and so on for each directory on the filesystem. This means many API calls, recursively down each path until you reach the end.
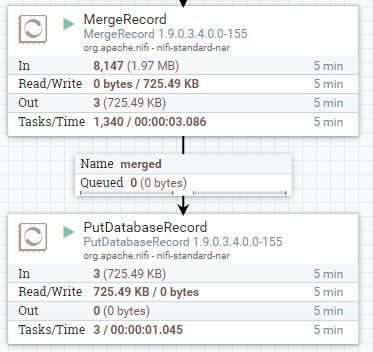
Provided in this article is an example NiFi flow which does exactly that. It will recursively query the Namenode API through each directory path, and grab a listing of all the files, owners, file size and store in a relational database (MySQL in this example). It will construct a JSON string for each file, and by merging all the JSON strings together as a NiFi record, we can do very large bulk inserts into the database.
An example of a JSON string will look like this, and we merge thousands of them together in bulk:
{
  "_owner" : "nifi",
  "_group" : "hdfs",
  "length" : 2205,
  "basepath" : "/tmp/oxygenating2020_tweets/",
  "filename" : "68b8531b-0caa-4b2e-942e-4d84dc5f6ebf.json",
  "fullpath" : "/tmp/oxygenating2020_tweets/68b8531b-0caa-4b2e-942e-4d84dc5f6ebf.json",
  "replication" : 3,
  "type" : "FILE"
}
Using the following record schema, we then merge and push this to a MySQL table:
{
  "namespace": "nifi",
  "name": "filerecord",
  "type": "record",
  "fields": [
    { "name": "_owner",        "type": "string" },
	{ "name": "_group",        "type": "string" },
	{ "name": "length",        "type": "long" },
	{ "name": "basepath",      "type": "string" },
	{ "name": "filename",      "type": ["null", "string"] },
	{ "name": "fullpath",      "type": "string" },
	{ "name": "replication",   "type": "int" },
	{ "name": "type",          "type": "string" }
  ]
}
The structure of the MySQL can be defined as:
CREATE TABLE filestats (
  `pk` bigint PRIMARY KEY AUTO_INCREMENT,
  `_owner` varchar(255),
  `_group` varchar(255),
  `length` bigint,
  `basepath` varchar(4096),
  `filename` varchar(4096),
  `fullpath` varchar(4096),
  `replication` int,
  `type` char(32),
  `ts` TIMESTAMP DEFAULT CURRENT_TIMESTAMP,
  `dt` DATE AS (DATE(ts))
);
CREATE INDEX idx_filestats_owner_length on filestats(_owner,length);
To make the flow generic, we have defined one variable called "baseurl" which will be the URL of your Name Node:
You also need to make adjustments to your database provider, database url and username & password. You can find the example flow here.
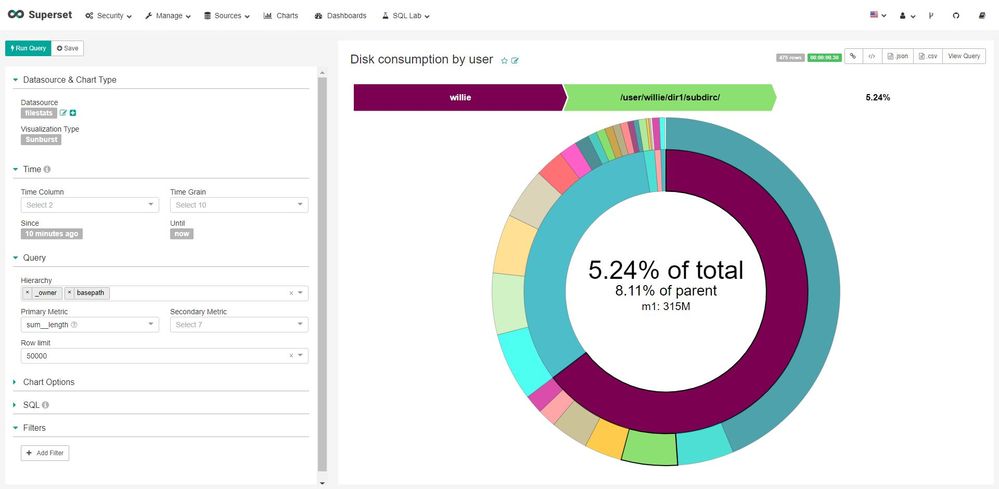
Using Superset, you can connect it to a relational database, and build various chart types to represent your data. One such chart type is the "Sunburst", which allows you to easily and visually navigate your disk consumption. Here is an example:
There's also a video to show a live visualisation which you can download to watch.
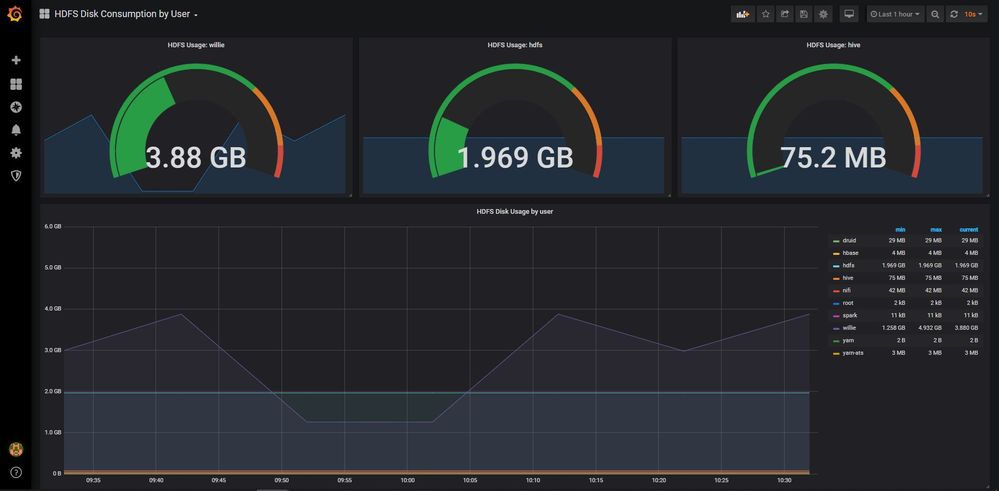
You can use Grafana to display the same data, but in a more timeseries way. By using a timeseries display, you can see the growth of disk consumption over a time period in order to make a prediction when a user will cross some threshold. This aids in monitoring and capacity planning. You can also setup Grafana to display and send alerts when thresholds are crossed.
An example of a Grafana dashboard:
You can also download a sample Grafana dashboard JSON file and import it for easy setup.


