Community Articles
- Cloudera Community
- Support
- Community Articles
- Machine Log Analytics on system logs using Apache ...
- Subscribe to RSS Feed
- Mark as New
- Mark as Read
- Bookmark
- Subscribe
- Printer Friendly Page
- Report Inappropriate Content
- Subscribe to RSS Feed
- Mark as New
- Mark as Read
- Bookmark
- Subscribe
- Printer Friendly Page
- Report Inappropriate Content
Created on 01-24-2017 08:13 PM - edited 08-17-2019 05:32 AM
-
Prerequisites:
- HDP 2.5 on Hortonworks Sandbox up and running.
- Apache NiFi installed and up and running: To quickly install Apache NiFi on the HDP 2.5 Sandbox by Ambari wizard, check Section 2 on the NiFi tutorial.
- Assumes a minimum of knowledge on how to access Ambari HDFS View, Hive View and Zeppelin UI on the sandbox.
- This demo has only been tested and developed for the HDP 2.5 Sandbox OS, which is CentOS 6.8. The NiFi flow may need to be tweaked depending on the target OS where the messages are generated.
- Enable rsyslog on your Sandbox:
In this tutorial, we will enable rsyslog to forward syslog messages to localhost on port 7780 as following:
- Edit /etc/rsyslog.conf and add the following line:
*.* @127.0.0.1:7780
- Restart syslog for the changes to take effect:
[root@sandbox ~]# service rsyslog restart
Shutting down system logger:                               [  OK  ]
Starting system logger:                                    [  OK  ]
- You can optionally read from the port 7780 to make sure that data is forwarded to port 7780 using tcpdump utility. tcpdump utility is not installed by default on the sandbox. You can install it as following:
yum install tcpdump
- You can read from the udp port 7780 using the following command:
tcpdump -i lo udp port 7780 -vv -X
If not seeing any entries, open a new ssh session, you should entries from pam_unix during authentication from tcpdump.
- NiFi Data Flow to ingest rsyslog
- Download the following syslogusermonitoring.xml NiFi Flow to your local hard drive:
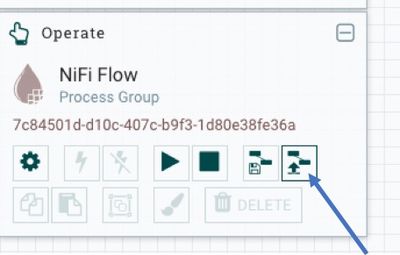
- Click on Upload Template and select the xml file previously saved:
- Drag the Add Template icon to the NiFi canvas:
- Choose the template SyslogUserMonitoring you just uploaded to NiFi.
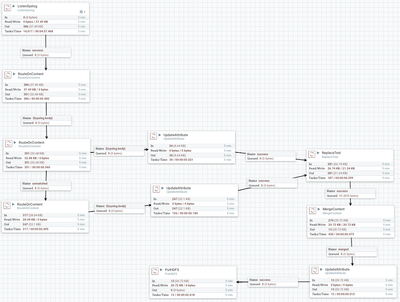
- You should see the following NiFi Data Flow:
- Before starting the NiFi flow, please create a directory /tmp/rsyslogs on HDFS where all the syslog entries ingested will be written. Open up all privileges to all on that directory to avoid any permission issues for NiFi. You could use the Ambari Files view to create the directory:
- By default, you may not get so much login activity on your sandbox. You can create some login activity by using the following script on your own sandbox. The script scans /etc/passwd for users and opens sessions through su, and failed authentications through sudo commands to just run echo commands. Please copy and paste the script below and save it as gensessions.sh as root on your sandbox.
Caution: Run this script at your own risk in a self-contained environment such as the sandbox only on your laptop, and not environments monitored by corporate security where the script can generate false alerts and lock you out.
#!/bin/bash

n=$1
x=`echo $(( ( RANDOM % 10 )  + 1 ))`
t=`echo $(( ( RANDOM % 5 )  ))`
f=`echo $(( ( RANDOM % 3 ) + 1 ))`

for ((i=1; i <= $n ; i++))
do
    #Successful su sessions
    for u in `grep bash /etc/passwd | grep home | awk -F ":" '{ print $1}' | shuf`
    do
       for (( c=1; c <= $x; c++ ))
       do
       su -c "echo Hello World from $u" $u
       sleep $t
       t=`echo $(( ( RANDOM % 5 )  ))`
    done
    x=`echo $(( ( RANDOM % 10 )  + 1 ))`

    #Failed sudo sessions
    for ((l=1 ; l <= $f ; l++ ))
    do
       su - $u -c "echo password | sudo -S echo 'Hello World'"
       sleep $t
       t=`echo $(( ( RANDOM % 5 )  ))`
    done
   f=`echo $(( ( RANDOM % 3 ) + 1 ))`
  done
done
- Open a new ssh session and run the script as root as following:
chmod +x gensessions.sh
./gensessions.sh 100
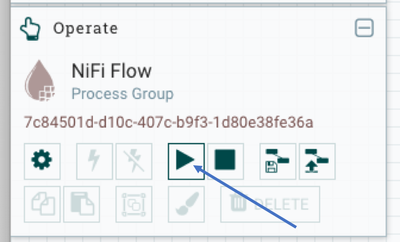
- You can now start the NiFi Data Flow by clicking on Start:
- After a few minutes, you should see files added in /tmp/rsyslogs in the Ambari File View.
- Hive Table creation
- Open the Hive view in Ambari and create the user_sessions external table as follows:
CREATE EXTERNAL TABLE USER_SESSIONS (
 id string,
 timestamp_ux bigint,
 hostname string,
 login string,
 byuser string,
 event string)
ROW FORMAT DELIMITED
FIELDS TERMINATED BY '|'
STORED AS TEXTFILE
LOCATION '/tmp/rsyslogs';
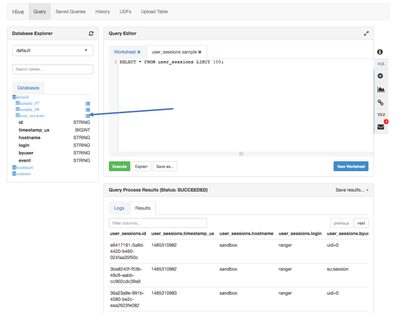
- You can view a sample of the data to make sure the data is now accessible through Hive by clicking on the icon 'Load sample data' next to the table in the Database Explorer:
At this point, we have ingested unstructured syslog text message through NiFi and extracted structured insights about user sessions activity to be able to do further analysis on it. We can now visualize this data using Apache Zeppelin.
- User sessions Analytics using SparkSQL and Apache Zeppelin
- Open the Zeppelin UI. You can do so from Ambari on the HDP 2.5 sandbox by clicking on the Zeppelin service, then selecting the Zeppelin UI from the Quick Links.
- Create a new Notebook called Syslog User Sessions Analysis for example.
- We can visualize the top 10 users opening most sessions against the sandbox using the following SparkSQL query:
%sql
select login, count(*) as num_login
from user_sessions
where event='opened'
group by login
order by num_login desc
limit 10
- We can also visualize for example the top 10 users with failed login attempts against the sandbox using the following SparkSQL query:
%sql
select login, count(*) as num_login
from user_sessions
where event='failure'
group by login
order by num_login desc
limit 10
- The data can be visualized in a pie chart as following:
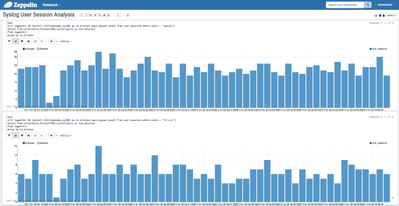
- We can also try to visualize the number of open sessions per minute on the sandbox using the following query:
%sql
with logpermin AS (
select int(timestamp_ux/60) as ts_minutes, login, byuser, event
from user_sessions
where event = "opened"
)
select from_unixtime(ts_minutes*60),count(login) as num_sessions
from logpermin
group by ts_minutes
- We may also want to identify periods where failed logins are higher to identify a potential attack pattern using the following query:
%sql
with logpermin AS (
select int(timestamp_ux/60) as ts_minutes,login,byuser,event
from user_sessions
where event = "failure"
)
select from_unixtime(ts_minutes*60),count(login) as num_sessions
from logpermin
group by ts_minutes
- The data above can be visualized using bar graphs as following:
Many other queries can be ran such as trying to identify if there is a particular user causing the failed logins. In this case, the running script generates a random activity, which is the distribution you are seeing in these analytics.
