Our Community is getting an upgrade! To get everything ready for the relaunch, we’ll be placing the site in read-only mode starting September 21st. We really appreciate your understanding while we get things set up behind the scenes. Catch up on all the exciting details about the move here. Need help or have questions? Drop us a line at [email protected]
Created on 05-08-202009:30 AM - edited on 04-21-202604:29 AM by GrazittiAPI
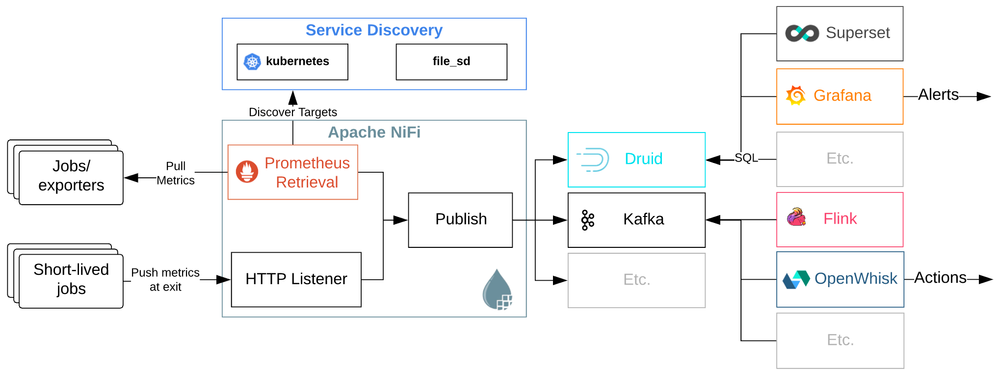
In Part 1, I shared an alternative architecture for Prometheus that increases scalability and flexibility of time series metric monitoring. In part 2, I will walk through an extension of the architecture that unites metric and log data with a unified, scalable data pipeline.
Part 1 Architecture
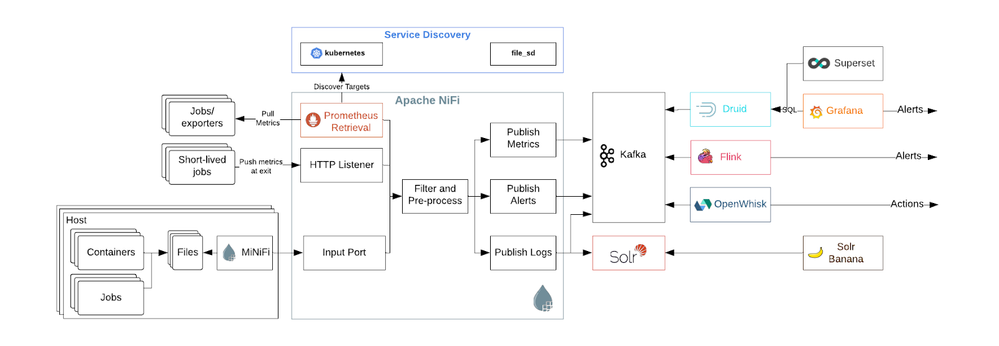
Part 2 Architecture
By adding log collection agents (e.g. MiNiFi) and a search cluster (e.g. Solr), the solution architecture can be extended to support log data in addition to time series metrics. This has the advantage of reducing duplicated infrastructure components for a more efficient and supportable solution.
Additional NiFi processors can be added to the flow for pre-processing (e.g. filtering, routing, scoring) the incoming data (e.g. ERROR vs INFO messages). Rulesets (e.g. Drools) from expert systems can be embedded directly into the flow, while ML models can be either directly embedded or hosted as a service that NiFi calls. Further downstream, Flink can be used to apply stateful stream processing (e.g. joins, windowing).
By applying these advanced analytics to metrics and logs in-stream, before the data lands, operations teams can shift from digging through charts and graphs to acting on intelligent, targeted alerts with the full context necessary to resolve any issue that may arise.
The journey to streaming analytics with ML and expert systems requires rethinking architectures, but the value gained from the timely insights that otherwise would not be possible is well worth the upfront refactoring and results in a much more stable and efficient system in the long run.