Community Articles
- Cloudera Community
- Support
- Community Articles
- Metron UI - Explained
- Subscribe to RSS Feed
- Mark as New
- Mark as Read
- Bookmark
- Subscribe
- Printer Friendly Page
- Report Inappropriate Content
- Subscribe to RSS Feed
- Mark as New
- Mark as Read
- Bookmark
- Subscribe
- Printer Friendly Page
- Report Inappropriate Content
Created on 04-10-2016 07:02 AM - edited 08-17-2019 12:51 PM
Metron provides a Kibana-based UI that is designed to be a single pane of glass to utilize the big data approach (having all data available to you at the same time) to filter through the irrelevant and display the just the information, alerts, and context an analyst/investigator is looking for all on the same pane. The Metron UI has several advantages over conventional SIEM tools, including flexibility, and having the needle as well as all the context for the needle presented together on the same screen, requiring no jumping around from console to console to gather the information.
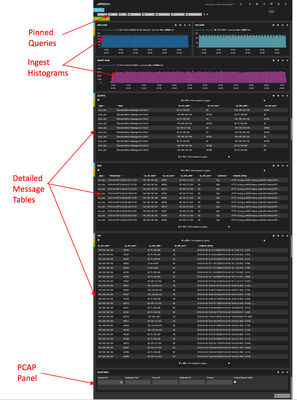
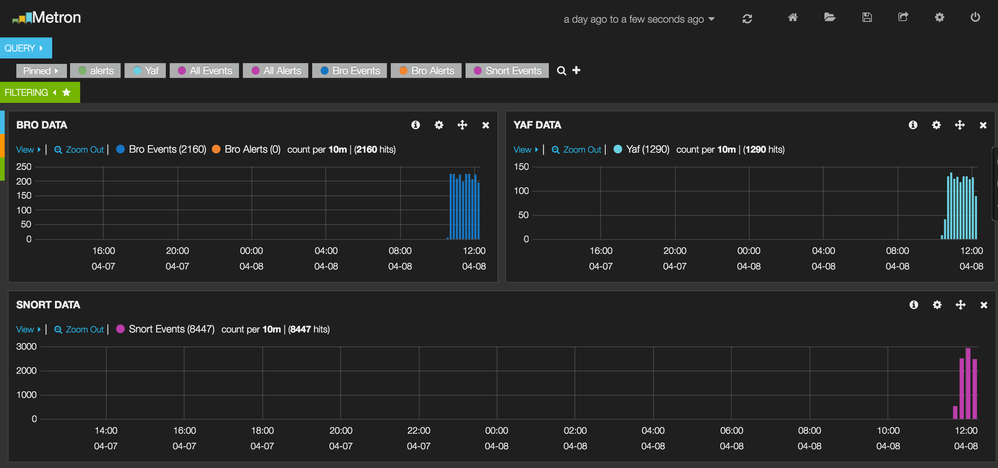
Let us first describe the parts of the UI panel. Specifically there are 4 sections: Pinned Queries and Filters, Ingest Histogram Panels, Detailed Message Tables, and finally the PCAP panel. We will go through all the parts in detail in this article and then we will how how to tie everything together and create a single pane of glass interface to filter through data and create context for the search.
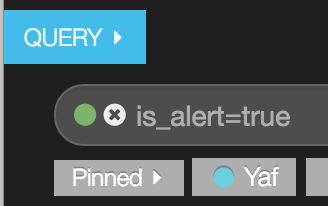
The first part of the UI we need to examine is pinned query. In Metron, if telemetry indexing is enabled, a rotating index for every telemetry will be created. By convention this index will have a name of [telemetry_name]_[timestamp]. Telemetry documents indexed into this index will by convention be called [telemetry_name]_doc. The key to creating a single pane of glass interface in Metron is to first create a pinned query referencing the telemetry document type. Metron TP1 provides 3 of such queries created for YAF, Bro, and Alerts (populated by Snort). When setup correctly these pinned queries would look something like this:
It is possible to add a custom pinned query for a new telemetry type. To do so click on the + sign next to the pinned query bar and enter a query looking for a new type of telemetry document. An example for adding Snort would look something like this:
Once the pinned queries are setup we can move on to setting up histogram panels and detailed tables for each individual telemetry. Again YAF, Bro, and Alerts (Snort) are setup out of the box for TP1, but adding additional sources is possible. Histogram panels represent ingest rates for each individual telemetry type and by convention we setup one per each type. To add an additional histogram panel for a new telemetry X you need to first create a pinned query for that telemetry type. Then (to make it easier) clone one of the existing TP1 histogram panels, change it's name to reflect the new name of the panel and switch the pinned query that the panel is pointing to (to the query that is pointing to x_doc).
The next step in the process is to create a detailed message panel. By convention there should be one panel per metadata telemetry and one panel that is a "catch all" panel for alerts. More specifically, Metro supports two types of messages: metadata and alerts. TP1 contains detailed metadata panels for YAF and Bro (metadata telemetries that don't contain alerts).
When Metron parses the telemetry on ingest it extracts and normalizes different parts of the message into a standard Metron JSON. The naming conventions and formatting of what different fields should be normalized to is contained here: Metron JSON Object. This is a growing list that is always evolving. Standardizing a and normalizing field names and format allows Metron to search different telemetry messages with a single query, a feature that we will touch upon later in this article. To setup your own details panel for a metadata telemetry X simply (a) make sure you have a pinned query setup to look for x_doc, (b) have an ingest histogram setup, and (c) clone one of the existing TP1 details panels, rename it, and point it to the x_doc pinned query. You will see the panel now being populated with indexed documents of type x_doc.
The second telemetry type that metron supports are alerts telemetries. Alerts telemetry come from IDS sensors like Snort or mixed telemetries like application logs that contain some metadata and some alert messages. While it is possible to setup a new panel for each alert telemetry, it is much more desirable to setup a single panel that contains all of the alerts. To do so we require a specific pinned query. Each telemetry message in Metron that contains an alert is tagged with is_alert=true field. So the pinned query to look for all alerts would look something like:
This guarantees that the query will pull in alerts form multiple telemetries (even mixed mode telemetries that have some metadata and some alerts associated with them). We can then setup a detailed table containing only the alerts. This is already setup for TP1 under the "Alerts" table.
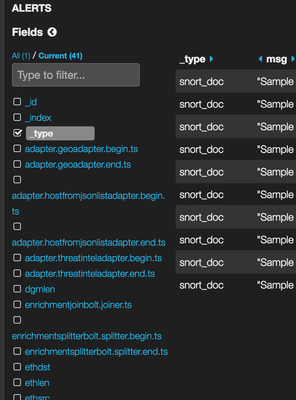
The fields displayed for each alerts table can be customized. Ideally you want the fields of most importance (as well as the standard fields that telemetries are correlated on) to be displayed. To do so click and check the field name boxes you want displayed by the table. An example of selecting the telemetry type to be displayed would look like this:
The last part of the UI is the PCAP panel. If the PCAP ingest is enabled in Metron it is possible to recover the actual PCAP associated with any number of alerts or telemetry messages. The PCAP panel, when setup correctly would look something like this:
The PCAP panel is backed by the PCAP Service, which will take the 5 tuple + start and end timestamps as arguments and deliver an associated PCAP to the end user. It is then possible to import each PCAP into Wireshark for additional fine-grained analysis of network traffic.
Metron UI Use Case: Finding a Needle in the Haystack
Now that we understand how the UI is setup lets run through scenarios for how to filter out the noise to get only to the alerts and context you are looking for. In order to do so we need to define global filters. Global filters are similar to pinned queries, but are applied globally to each UI panel and only display information specified by the query. To define a global query expand the filtering tab and click on the + icon to define n number of filters. For example to filter out the panels to only display http traffic originating from port 80 a series of filters would look as follows:
After these filters are setup all Metron panels will filter through only with the information specified by these queries. This is powerful because since all the telemetries are in a standard Metron JSON format a single filter will be applicable to all telemetry types. So the alerts and meta data entries associated with the set of filters will filter through. Additional filters can be defined for geo data as well as any of the enrichments. So in our example the panels when looking at Snort alerts both histogram and alerts panels would filter as follows:
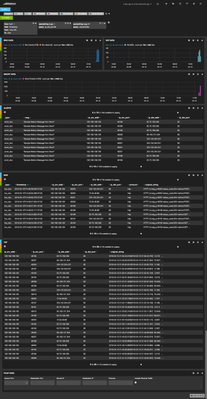
The same filter would be applied to the rest of the panels so that the contextual information for these alerts would be displayed. The resulting filtered dashboard would look as follows:
The benefit of having this arrangement is that by progressively stacking filters you are able to get just to the information you are looking for. Since every panel updates all the context you need (since every single telemetry source has a panel) is all presented on the same screen. So there is no additional consoles to jump through. Also, PCAP retrieval is right there as well so if additional forensic analysis is needed that service is available on the same UI as well.

Created on 01-24-2017 11:19 AM
- Mark as Read
- Mark as New
- Bookmark
- Permalink
- Report Inappropriate Content
Good information. Thanks
