Community Articles
- Cloudera Community
- Support
- Community Articles
- NiFi/HDF Dataflow Optimization (Part 2 of 2)
- Subscribe to RSS Feed
- Mark as New
- Mark as Read
- Bookmark
- Subscribe
- Printer Friendly Page
- Report Inappropriate Content
- Subscribe to RSS Feed
- Mark as New
- Mark as Read
- Bookmark
- Subscribe
- Printer Friendly Page
- Report Inappropriate Content
Created on
01-13-2016
07:15 PM
- edited on
04-21-2026
05:33 AM
by
GrazittiAPI
This is part 2 of the Dataflow Optimization tutorial. Part 1 can be found here: NiFi/HDF Dataflow Optimization part 1
-----------------------------------------------------------------------------------------------------------------------------------------
How do I prevent my system/processors from becoming overwhelmed?
Another aspect of optimization is preventing the dataflows from overwhelming the underlying system and affecting NiFi software stability and/or performance. If allowed to run unconstrained, it is more likely to see a severe performance hit. You are more likely to see severe performance hit if dataflows are unbounded and the content repo fills 100%
For example, if you have 50MB for the content_repository partition and data normally is delivered via an input port in groups of 10MB. What would happen if the data source was down for a few hours and then came back online with a backlog of 75MB? Once the content_repository filled, the input port would start generating errors when trying to write the files it was receiving. The performance of NiFi would drop because the disk/disks where the content_repository resided would be trying write new files while at the same time NiFi would be trying to access the disk/s to deal with the current flowfiles. Backpressure can be configured based on number of objects and/or the size of the flowfiles in the connection.
Using backpressure would be one way to prevent this scenario, below is an example:
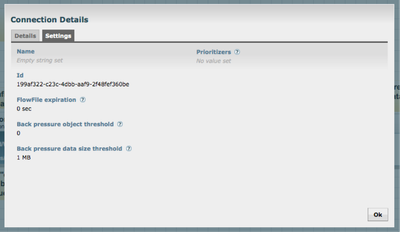
Backpressure is set in the connection from the input port to the ControlRate processor:
It can be seen that in the above figure that if the backlog of data reaches 1 MB, then the input port would not be able to receive data until the backlog dropped below the threshold and then incoming data from the source system would resume. This configuration allows NiFi to receive the backlog of data at a rate that won't over utilize the system resources. Additionally, adding the ControlRate processor to the flow will ensure that the backlog of data will not overwhelm any processors further down the flow path. This method of combining backpressure with the ControlRate processor is easier than trying to set backpressure in every connection through the complete flow path.
Using ControlRate processor to control the rate of data through a flow
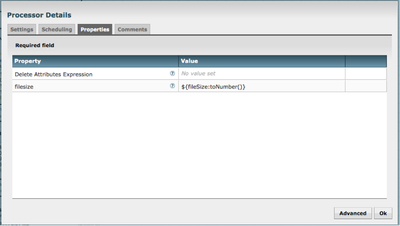
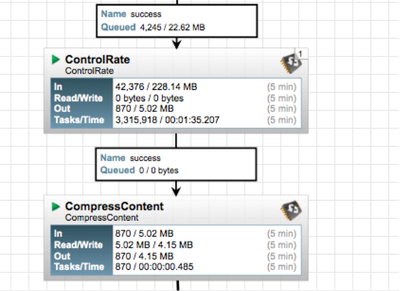
The ControlRate processor is good example of using one processor to prevent another from becoming overwhelmed and/or overwhelming the overall flow. For example, the DFM is only able to allocate one concurrent task to the CompressContent processor, if the queue to the processor becomes too large, that one concurrent task would only be able to scan the queue to determine which flowfile should be compressed next. Meaning, it would spend all of its time looking at its queue and never actually compressing any flow files. Using the above example of the CompressContent processor, then we could use the ControlRate processor to prevent the processor from becoming overwhelmed, by using data rate, flowfile count or even a flowfile attribute to control the rate of data. The below example is using the added filesize attribute to control the rate of data, the first figure shows the configuration of the UpdateAttribute processor adding the filesize attribute:
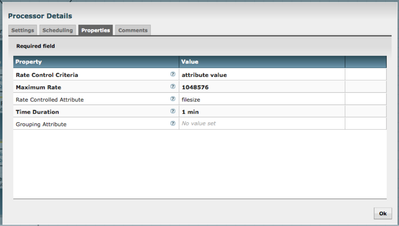
The configuration of the ControlRate processor is shown below. It is set to allow ~1 MB/minute, based on the cumulative size of files through the processor.
Understanding what resources a processor uses
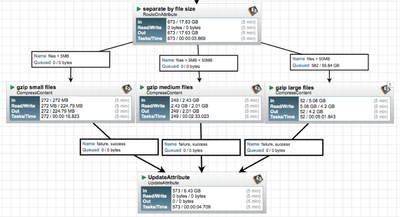
Another aspect of dataflow optimization is to understand the resources needed by each processor. This will allow better dataflow performance. For instance, the CompressContent processor will use 1 CPU/concurrent task, so if this processor has 4 concurrent tasks and there are four files in the queue, then 4 CPUs will be utilized by this processor until the files have been compressed. For small files this becomes less of a resource bottleneck than dealing with large files. A good example of this would be to have small, medium and large files all go down a separate flow paths into 3 different CompressContent processors, each with their own number of concurrent tasks. In the example below, all three CompressContent processors have one concurrent task.
This diagram provides a good example of optimizing throughput. The “Tasks/Time” for each of the CompressContent processors clearly show that the amount of time required to compress larger files is exponentially bigger as the files increase in size. This provides better use of CPU to process the maximum number of files and not letting the arbitrary large files slow down the entire flow. This isn’t specifically noted in the documentation, but is known by the fact that the only way to compress a file either inside or out of NiFi is to use a CPU per file being compressed/uncompressed on the system where the operation is being done.
Be aware that some of the documentation for the processors points out when a particular processor has a behavior that should be made aware of. For example the documentation for the MergeContent processor has the following line: It is recommended that the Processor be configured with only a single incoming connection, as Group of FlowFiles will not be created from FlowFiles in different connections.
The size of FlowFiles and the number of FlowFiles traversing various dataflow paths will have different impacts on some processors. Learning to read the information on a processor can help you determine when and where to apply some or all of the discussed optimization strategies.
How does NiFi help you find where/how you can optimize?
There is a great deal of information provided by each processor, that can assist the DFM in determining where the trouble spots could be in the flow; see the description below:
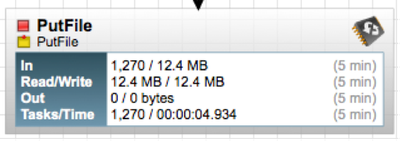
In: The amount of data that the Processor has pulled from the queues of its incoming Connections based on a sliding 5-minute window. This value is represented as <count> / <size> where <count> is the number of FlowFiles that have been pulled from the queues and <size> is the total size of those FlowFiles' content. In this example, the Processor has pulled 1270 FlowFiles from the input queues, for a total of 12.4 megabytes (MB).
Read/Write: The total size of the FlowFile content that the Processor has read from disk and written to disk. This provides valuable information about the I/O performance that this Processor requires. Some Processors may only read the data without writing anything while some will not read the data but will only write data. Others will neither read nor write data, and some Processors will both read and write data. In this example, we see that in the past five minutes, this Processor has read 12.4 MB of the FlowFile content and has written 12.4 MB as well. This is what we would expect since this Processor simply copies the contents of a FlowFile to disk.
Out: The amount of data that the Processor has transferred to its outbound Connections. This does not include FlowFiles that the Processor removes itself, or FlowFiles that are routed to connections that are auto-terminated. Like the “In” metric above, this value is represented as <count> / <size> where <count> is the number of FlowFiles that have been transferred to outbound Connections and <size> is the total size of those FlowFiles' content. In this example, all of the files are written to disk and the connections are auto terminated, so no files have been moved out to downstream connections.
Tasks/Time: Reflects the number of tasks that completed their run in the last 5 minutes and the reported total amount of time those tasks took to complete. You may have 1 thread and a single task takes 20 minutes to complete. When it completes it is added to this cumulative report for the next 5 minutes. The format of the time is <hour>:<minute>:<second>. Note that the amount of time taken can exceed five minutes, because many tasks can be executed in parallel. For instance, if the Processor is scheduled to run with 60 Concurrent tasks, and each of those tasks takes one second to complete, it is possible that all 60 tasks will be completed in a single second. However, in this case we will see the Time metric showing that it took 60 seconds, instead of 1 second.
Utilize the information provided by the processors, number of reads/write and tasks/time per task to find “hot spots” on the graph. For instance, if a large number of tasks ran but the amount of data that passed through the processor is low, then the processor might be configured to run too often or with too many concurrent tasks. At the very least a closer look is warranted for the processor. A processor with few completed tasks along with a high task time indicates that this processor is CPU intensive. If the dataflow volume is high and a processor show a high number of completed threads and high task time, performance can be improved by increasing the run duration in the processor scheduling.
Are there places in the graph were data is backlogged or which processors are not processing the rate of files being passed to them?
If there is a connection in the flow where data is always backlogged, it can be a point of concern if any delay in processing the data is unacceptable. But, simply adding more concurrent tasks to the processor with the backlogged can lead to thread starvation in another part of the graph (covered in more detail below). Here again, the DFM must take care in understanding why the data is backing up at this particular point in the graph. It simply could be a processor that is very CPU intensive and there are only so many CPUs to be utilized throughout the graph. The files might be very large for the system and it might require a read and a write for each file, which are expensive operations. If resources aren’t an issue, then add more concurrent tasks and see if the backlog is resolved. If resources are an issue, then either the flow will have to be redesigned to better utilize what is available or else the work load will have to be distributed across multiple systems, meaning clustering two or more systems to reduce the load on any one system. Files could be backlogging because the processor that is working on them is I/O intensive. Processor stats should show this. Check your disks; is I/O at or near 100%? Adding more threads will not help process files faster but instead will lead to thread starvation.
NiFi Thread starvation
Another aspect to optimization is how processors can be configured to take too many of the available resources in one area of the flow, and then thread starving another area of the flow.
Say, there is a processor that is CPU and disk intensive that requires 10 concurrent tasks to maintain the daily operational flow. Then the graph is modified to add additional dataflows, which require system resources. After the additional dataflow has been added to the graph, it is noticed that the processor with 10 concurrent tasks is unable to keep up with the data rate. So, an additional 5 concurrent tasks are added to the processor. Then another flow on the graph starts backing up data and then additional concurrent tasks are added to that flow and so and so on… Soon, too many concurrent tasks have been added to the graph that the dataflow never actually gets a thread, the system spends all of the resources deciding which processor should get the threads, but is never allowed to complete the task, and the system is stuck in this cycle.
To prevent this from happening to a dataflow, after each update or addition to the graph, the DFM should examine the current level of utilization of system resources. If after an update or addition the data begins to backlog in a point on the flow not previously seen, then the change has overwhelmed the system in some way and it is advised the added flow be turned off until it can determined what system resources are being over utilized. Another solution would be load balancing the flow over two or more systems by cluster the systems.
When to Cluster
Physical resource exhaustion can and does occur even with an optimized dataflow. When this occurs the best approach is to spread the data load out across multiple NiFi instances in a NiFi cluster.
NiFi Administrators or Dataflow Managers (DFMs) may find that using one instance of NiFi on a single server is not enough to process the amount of data they have. So, one solution is to run the same dataflow on multiple separate NiFi servers. However, this creates a management problem, because each time DFMs want to change or update the dataflow, they must make those changes on each server and then monitor each server individually. By clustering the NiFi servers, it’s possible to have that increased processing capability along with a single interface through which to make dataflow changes and monitor the dataflow. Clustering allows the DFM to make each change only once, and that change is then replicated to all the nodes of the cluster. Through the single interface, the DFM may also monitor the health and status of all the nodes.
The design of NiFi clustering is a simple master/slave model where there is a master and one or more slaves. In NiFi clustering, we call the master the NiFi Cluster Manager (NCM), and the slaves are called Nodes. While the model is that of master and slave, if the NCM dies, the nodes are all instructed to continue operating, as they were to ensure the dataflow remains live. The absence of the NCM simply means new nodes cannot join the cluster and cluster flow changes cannot occur until the NCM is restored.

