Community Articles
- Cloudera Community
- Support
- Community Articles
- Telecom DeviceManagerDemo
- Subscribe to RSS Feed
- Mark as New
- Mark as Read
- Bookmark
- Subscribe
- Printer Friendly Page
- Report Inappropriate Content
- Subscribe to RSS Feed
- Mark as New
- Mark as Read
- Bookmark
- Subscribe
- Printer Friendly Page
- Report Inappropriate Content
Created on 06-10-2016 10:39 PM - edited 08-17-2019 12:10 PM
This beautiful demo is courtesy of Vadim Vaks. It utilizes a Lambda architecture built using the Hortonworks Data Platform and Hortonworks Data Flow. The demo shows how a Telecom can manage customer device outages using predictive maintenance and a connected workforce.
Overview:
Customer devices that are simulated in this specific telecom usecase are SetTopBoxes(STB) in individual homes that might need assistance from a technician, when something goes wrong. Attributes associated with STB are:
1. SignalStrength
2. Internal Temperature
3. Status
Location of technician is tracked and plotted on MapUI using the latitude and longitudes.
Two cycles of operation of STBs are:
1. Normal Cycle: When status is normal and internal temperature of STB fluctuates up and down
2. Failure Cycle: When status is not normal and internal temperature of STBox incrementally goes high until 109 degrees.
Step 1: Prerequisites for the Demo Set Up:
For instructions to install this demo on an HDP 2.4 Sandbox,a good place to start is the README here DeviceMangerDemo
1. Clone the DeviceManagerDemo repository from here and follow the steps suggested below code:
git clone https://github.com/vakshorton/DeviceManagerDemo.git
cd DeviceManagerDemo
./install.sh
2. The install.sh handles the installation and starting of artifacts necessary for the demo onto the Sandbox
- Looking for the latest Hortonworks sandbox version
- Creating the NiFi service configuration, installing and starting it using the Ambari ReST API
- Importing the DeviceMangerDemo NiFi template, instantiating and starting the NiFi Flow using the NiFi ReST API
TEMPLATEID=$(curl -v -F template=@"Nifi/template/DeviceManagerDemo.xml" -X POST http://sandbox.hortonworks.com:9090/nifi-api/controller/templates | grep -Po '<id>([a-z0-9-]+)' | grep -Po '>([a-z0-9-]+)' | grep -Po '([a-z0-9-]+)')
REVISION=$(curl -u admin:admin -i -X GET http://sandbox.hortonworks.com:9090/nifi-api/controller/revision |grep -Po '\"version\":([0-9]+)' | grep -Po '([0-9]+)')

curl -u admin:admin -i -H "Content-Type:application/x-www-form-urlencoded" -d "templateId=$TEMPLATEID&originX=100&originY=100&version=$REVISION" -X POST http://sandbox.hortonworks.com:9090/nifi-api/controller/process-groups/root/template-instance
- Starting the Kafka Ambari service using the Ambari ReST API and configuring the TechnicianEvent and DeviceEvents topics using the kafka-topics shell script
/usr/hdp/current/kafka-broker/bin/kafka-topics.sh --create --zookeeper sandbox.hortonworks.com:2181 --replication-factor 1 --partitions 1 --topic DeviceEvents
/usr/hdp/current/kafka-broker/bin/kafka-topics.sh --create --zookeeper sandbox.hortonworks.com:2181 --replication-factor 1 --partitions 1 --topic TechnicianEvent
- Changing YARN Container Memory Size -/var/lib/ambari-server/resources/scripts/configs.sh set sandbox.hortonworks.com Sandbox yarn-site "yarn.scheduler.maximum-allocation-mb""6144"
- Starting the HBase service using the Ambari ReST API
- Installing ad starting Docker service, download docker images, creating the working folder with the slider for MapUI,
- Starting the Storm service using the Ambari ReST API, and deploying the storm topology here
storm jar /home/storm/DeviceMonitor-0.0.1-SNAPSHOT.jar com.hortonworks.iot.topology.DeviceMonitorTopology
3. Install.sh reboots the ambari-server, wait for that and then run the below steps
cd DeviceManagerDemo
./startDemoServices.sh
4.The startDemoServices.sh should be run each time the Sandbox VM is (re)started, after all of the default Sandbox services come up successfully. It handles the initialization of all of the application-specific components of the demo. The script starts the following Amabari Services via ReST API
- Kafka
- NiFi
- Storm
- Docker
- UI Servlet and CometD Server on YARN using Slider
- HBase
Step 2: Understanding the code, nifi processors and then navigate to the UI
1.First,make sure the kafka events are created by the install.sh script by doing below. You should see the two event names
cd /usr/hdp/current/kafkabroker/bin/ ./kafkatopics.sh list zookeeper localhost:2181
2.The install.sh script that was run in the previous section creates and submits a storm topology named DeviceMonitor that has spouts and bolts
Spouts: 1. DeviceSpout
Bolts:
- EnrichDeviceStatus.java
- IncidentDetector.java
- PersistTechnicianLocation.java
- PrintDeviceAlert.java
- PublishDeviceStatus.java
What each of the spouts does is simply look for the status of the device('Normal' or not) and technician( 'Assigned' or not) and enqueue or emit the status to bolts for future event decisions. Bolts process the data based on the event type (device/technician) like publishing the device status and technician location, updating the Hbase tables, enriching the device status, intelligent incident detection, printing alerts, routing the technician etc.
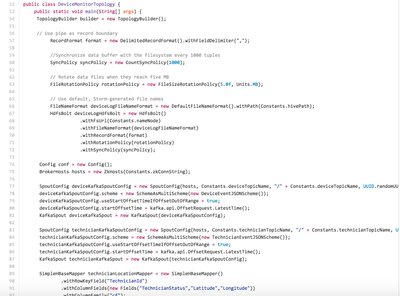
Various configurations are done in DeviceMonitorTopology (detailed code here )that set the bolts and spouts using several methods like TopologyBuilder() ,setBolt(), setSpout(), SpoutConfig() etc
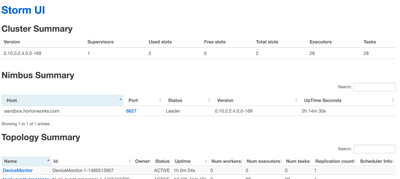
3. Verify the storm topology is properly submitted, by going to the StormUI quick link on Ambari and you should see below:
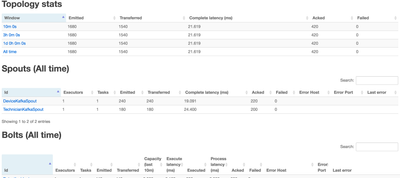
Spouts and Bolts on the Storm UI:
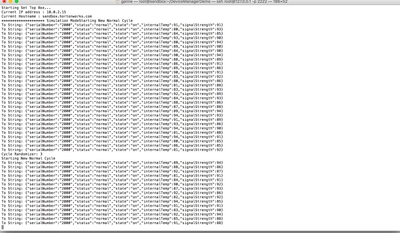
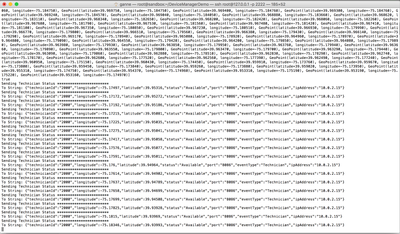
4. Inoder to see the events get simulated,Run the simulator jars from two different CLIs:
cd DeviceManagerDemo
java -jar DeviceSimulator-0.0.1-SNAPSHOT-jar-with-dependencies.jar Technician 1000 Simulation

java -jar DeviceSimulator-0.0.1-SNAPSHOT-jar-with-dependencies.jar STB 1000 Simulation
DeviceStatus and TechnicianLocation Events are generated by the jars:
Technician:
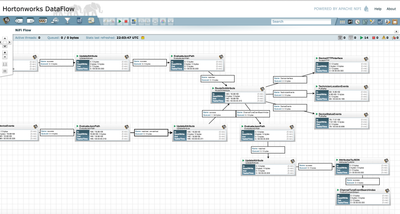
5. After importing the Devicemangerdemo Nifi template, it look like below, with several processors connected and running the data flow in sequential fashion.
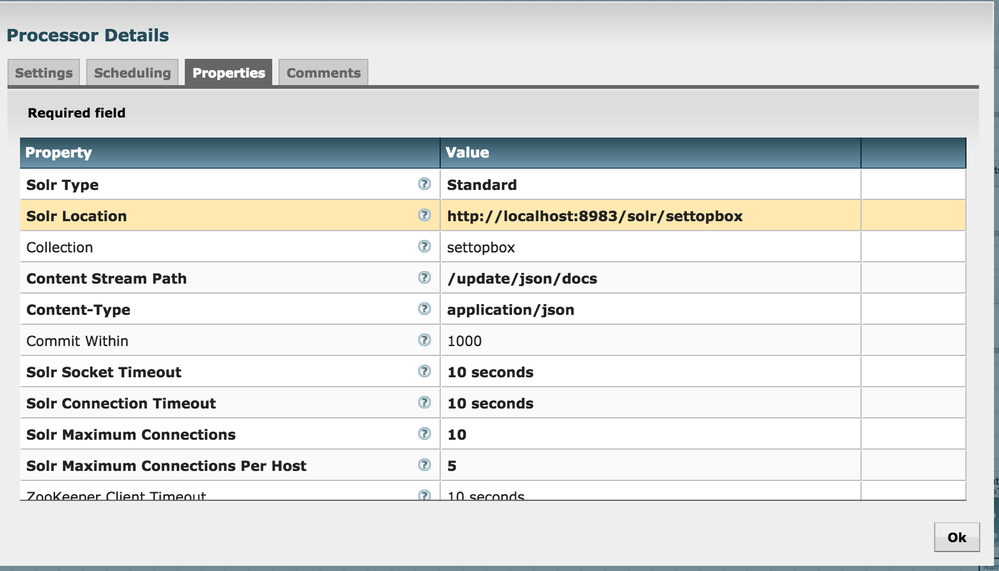
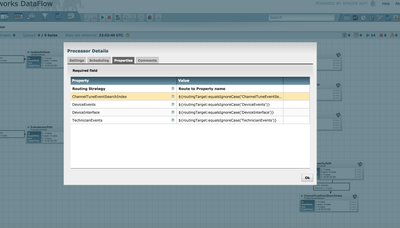
6.Some of the major decision making processors involved and by viewing their configurations,one can see the content in 'properties' tab as below:
1.RouteOnAttribute:
ChannelTuneEventSearchIndex :${routingTarget:equalsIgnoreCase('ChannelTuneEventSearchIndex')}
DeviceEvents :${routingTarget:equalsIgnoreCase('DeviceEvents')}
TechnicianEvents :${routingTarget:equalsIgnoreCase('TechnicianEvents')}
DeviceInterface :${routingTarget:equalsIgnoreCase('DeviceInterface')}
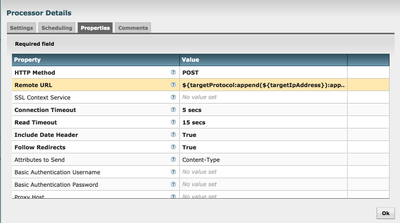
2.DeviceHTTPInterface:
HTTP Method: POST
RemoteURL: ${targetProtocol:append(${targetIpAddress}):append(':'):append(${targetPort}):append('/server/TechnicianService')}
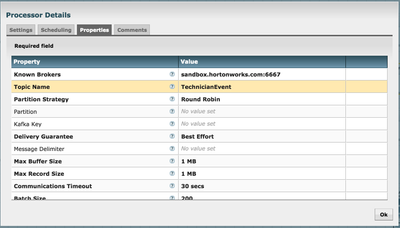
3.TechnicianlocationEvents: These technician information is pushed to the corresponding Kafka topic.
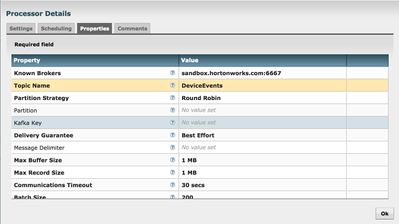
4.DeviceStatusEvents : Device status and other related event data is pushed to the corresponding Kafka topic.
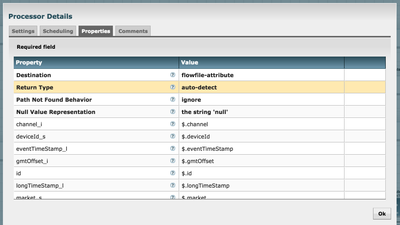
5. EvaluateJSONPath
Several jsonpaths that are user-defined properties like channel_i,deviceId_s,eventTimeStamp_I etc are evaluated against the content of the flowfile and written to the corresponding attributes in the next step of dataflow.
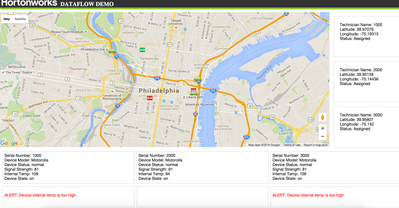
7. Now navigate to the MapUI to see the car of the technician moving arround, which was initiated by Slider here http://sandbox.hortonworks.com:8090/MapUI/DeviceMap
8. DeviceMonitorNostradamus section of the code utilizes the spark streaming and prediction capabilities. The enriched technician data from HBase is streamed into a Spark data model to predict possible outage of a customer device and later publish the predictions to MapUI web application using CometD server.
Conclusion:
This telecom demo gives overview of an IoT data application scenario and exposes the power of hortonworks dataflow technologies like Nifi, Kafka,Storm along with HBase, Spark and Slider.
