Support Questions
- Cloudera Community
- Support
- Support Questions
- Alert Configuration on Ambari
- Subscribe to RSS Feed
- Mark Question as New
- Mark Question as Read
- Float this Question for Current User
- Bookmark
- Subscribe
- Mute
- Printer Friendly Page
- Subscribe to RSS Feed
- Mark Question as New
- Mark Question as Read
- Float this Question for Current User
- Bookmark
- Subscribe
- Mute
- Printer Friendly Page
Alert Configuration on Ambari
- Labels:
-
Apache Ambari
Created 11-09-2015 09:23 PM
- Mark as New
- Bookmark
- Subscribe
- Mute
- Subscribe to RSS Feed
- Permalink
- Report Inappropriate Content
How to adjust thresholds on Ambari alerts?
For example, the following Ambari Agent Disk Usage alert has 50% WARNING and 80% CRITICAL threasholds but what do i need to do if i would like to make 60% usage as CRITICAL?
This host-level alert is triggered if the amount of disk space used on a host goes above specific thresholds. The default values are 50% for WARNING and 80% for CRITICAL.
and also can i make these alerts specific to mount/volume on Ambari host server?
Thanks,
Created 11-09-2015 09:30 PM
- Mark as New
- Bookmark
- Subscribe
- Mute
- Subscribe to RSS Feed
- Permalink
- Report Inappropriate Content
Please see this. You can change these values and restart ambari-server
/var/lib/ambari-server/resources/host_scripts/alert_disk_space.py
# defaults in case no script parameters are passed
MIN_FREE_SPACE_DEFAULT = 5000000000L #5GB
PERCENT_USED_WARNING_DEFAULT = 50
PERCENT_USED_CRITICAL_DEFAULT = 80
Can i make these alerts specific to mount/volume on Ambari host server?
Yes, you should be able to customize the above script.
Created 11-09-2015 10:55 PM
- Mark as New
- Bookmark
- Subscribe
- Mute
- Subscribe to RSS Feed
- Permalink
- Report Inappropriate Content
Thank you @Neeraj
Created 08-01-2016 04:27 AM
- Mark as New
- Bookmark
- Subscribe
- Mute
- Subscribe to RSS Feed
- Permalink
- Report Inappropriate Content
I have tried the above settings and restarted the ambari server but seems to have no effect on the alert. Anything i am missing. Following are my current settings..
# defaults in case no script parameters are passed
MIN_FREE_SPACE_DEFAULT = 1000000000L
PERCENT_USED_WARNING_DEFAULT = 80
PERCENT_USED_CRITICAL_DEFAULT = 90
And the Error below :
| Ambari / xxx | WARN for 5 minutes | 1 | Capacity Used: [60.47%, 6.3 GB], Capacity Total: [10.4 GB], path=/usr/hdp |
Thanks for looking
Rao
Created 01-03-2017 09:43 AM
- Mark as New
- Bookmark
- Subscribe
- Mute
- Subscribe to RSS Feed
- Permalink
- Report Inappropriate Content
I tried changing the description from the ambari UI but it didn't work. Then I tried modifying the alert_disk_space.py script with PERCENT_USED_WARNING_DEFAULT = 60 and restarted my ambari server. but still I can't see the changes from the UI. And my alert which got generated for 50% utilization still exist. Please advise.
Created on 11-09-2015 11:54 PM - edited 08-19-2019 05:51 AM
- Mark as New
- Bookmark
- Subscribe
- Mute
- Subscribe to RSS Feed
- Permalink
- Report Inappropriate Content
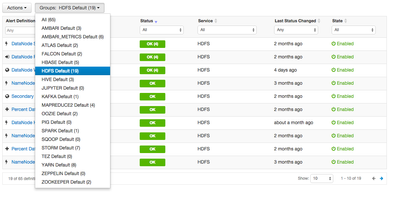
You can adjust the alert thresholds graphically from within Ambari. From the Ambari dashboard, click on the "Alerts" tab at the top of the page. Then select the alert group that you are interested in from the dropdown menu (HDFS Default in this case). Now you can click the specific alert (e.g., "DataNode Storage") you are interested in to see how it is configured. To edit the thresholds you will need to click the "edit" link on the configuration page to begin editing.
The image below is taken from an Ambari 2.1 instance.
Created 11-09-2015 11:57 PM
- Mark as New
- Bookmark
- Subscribe
- Mute
- Subscribe to RSS Feed
- Permalink
- Report Inappropriate Content
@Brandon Wilson Can we do the dame for OS mount point?
The question is for server disk usage alerts like root file system usage.
Created 11-10-2015 12:19 AM
- Mark as New
- Bookmark
- Subscribe
- Mute
- Subscribe to RSS Feed
- Permalink
- Report Inappropriate Content
I did misread the specific alert that is in question but the process of changing the thresholds is the same.
That being said, the ability to change the specific mount is not available for this alert AFAIK. However, you could built your own custom alert for such purposes. Olivier has an example in his github that could be used as an initial guidance and then tailored to this specific situation: https://github.com/monolive/ambari-custom-alerts
Created 11-10-2015 12:02 AM
- Mark as New
- Bookmark
- Subscribe
- Mute
- Subscribe to RSS Feed
- Permalink
- Report Inappropriate Content
Yes. I see that we can edit thresholds for some metrics but for metrics that are type "script" we need to change the script as suggested by @Neeraj
Created 08-12-2016 01:47 AM
- Mark as New
- Bookmark
- Subscribe
- Mute
- Subscribe to RSS Feed
- Permalink
- Report Inappropriate Content
if I create my custom alert script and register it with the json. Will it be possible in future ti change the threshold ? Can I edit the alert definition? or I have to make the script not to take threshold values from the alert definition?


