Support Questions
- Cloudera Community
- Support
- Support Questions
- Re: Ambari metrics using 100% cpu
- Subscribe to RSS Feed
- Mark Question as New
- Mark Question as Read
- Float this Question for Current User
- Bookmark
- Subscribe
- Mute
- Printer Friendly Page
- Subscribe to RSS Feed
- Mark Question as New
- Mark Question as Read
- Float this Question for Current User
- Bookmark
- Subscribe
- Mute
- Printer Friendly Page
Ambari metrics using 100% cpu
- Labels:
-
Apache Ambari
-
Apache HBase
Created on 12-16-2015 04:32 PM - edited 08-19-2019 05:32 AM
- Mark as New
- Bookmark
- Subscribe
- Mute
- Subscribe to RSS Feed
- Permalink
- Report Inappropriate Content
I have a HDP 2.3.0 cluster with 4 nodes. I noticed this process was consuming 100% cpu on my NameNode:
ams 5386 223 5.0 3596120 1666616 ? Sl 13:50 46:56 /usr/jdk64/jdk1.8.0_40/bin/java -Dproc_master -XX:OnOutOfMemoryError=kill -9 %p -Xmx1536m -XX:+UseConcMarkSweepGC -XX:ErrorFile=/var/log/ambari-metrics-collector/hs_err_pid%p.log -Djava.io.tmpdir=/opt/var/lib/ambari-metrics-collector/hbase-tmp -Djava.library.path=/usr/lib/ams-hbase/lib/hadoop-native/ -verbose:gc -XX:+PrintGCDetails -XX:+PrintGCDateStamps -Xloggc:/var/log/ambari-metrics-collector/gc.log-201512161350 -Xms1536m -Xmx1536m -Xmn256m -XX:CMSInitiatingOccupancyFraction=70 -XX:+UseCMSInitiatingOccupancyOnly -Dhbase.log.dir=/var/log/ambari-metrics-collector -Dhbase.log.file=hbase-ams-master-NPAA1809.petrobras.biz.log -Dhbase.home.dir=/usr/lib/ams-hbase/bin/.. -Dhbase.id.str=ams -Dhbase.root.logger=INFO,RFA -Dhbase.security.logger=INFO,RFAS org.apache.hadoop.hbase.master.HMaster start
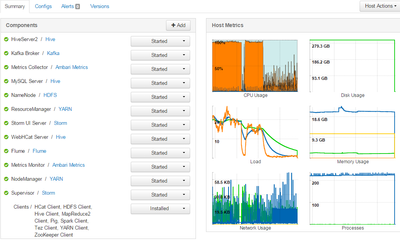
But my cluster does not have Hbase installed. Then I simply killed this process, but Ambari metrics went down together. After I restarted Ambari metrics, this process continues trying to executing and always consuming a lot of CPU. Here is a print of Ambari Metrics durint time of my actions.
How can I configure AMS to stop trying to monitor HBase?
Created 12-16-2015 04:55 PM
- Mark as New
- Bookmark
- Subscribe
- Mute
- Subscribe to RSS Feed
- Permalink
- Report Inappropriate Content
What is the AMS operation mode ("Metrics Service operation mode" config) ?
Please share all the memory configs of AMS along with the memory in the node. The following configs will be useful.
In ams-env - metrics_collector_heapsize
In ams-hbase-env - hbase_regionserver_heapsize,hbase_master_maxperm_size, hbase_master_xmn_size, hbase_regionserver_heapsize, regionserver_xmn_size
and the output of "free -m"
Created 12-16-2015 07:01 PM
- Mark as New
- Bookmark
- Subscribe
- Mute
- Subscribe to RSS Feed
- Permalink
- Report Inappropriate Content
Here is my config files for ambari-metrics-collector
Created 12-16-2015 07:35 PM
- Mark as New
- Bookmark
- Subscribe
- Mute
- Subscribe to RSS Feed
- Permalink
- Report Inappropriate Content
@Vitor Batista Can you try setting server.timeline.metrics.cache.disabled = true in ambari.properties file and restart ambari-server for a try? I don't think you have enough resources on this machine.
Created 12-16-2015 09:53 PM
- Mark as New
- Bookmark
- Subscribe
- Mute
- Subscribe to RSS Feed
- Permalink
- Report Inappropriate Content
I tried, but nothing changed. Where should I configure the collector interval. I don't need a "real-time" monitoring. Maybe 1 measurement per minute is enough.
Created 12-17-2015 12:18 AM
- Mark as New
- Bookmark
- Subscribe
- Mute
- Subscribe to RSS Feed
- Permalink
- Report Inappropriate Content
@Vitor Batista As @Guilherme Braccialli rightly mentioned Ambari Metrics monitor all services / hosts and it consumes resources to run. For small test environments you can stop Ambari Metrics with few cpu, you can stop ambari metrics, it wont affect other components. Our Sandbox, for example, does not have Ambari Metrics started by default. This VM size you have is very small for so many components.
Created 12-16-2015 04:55 PM
- Mark as New
- Bookmark
- Subscribe
- Mute
- Subscribe to RSS Feed
- Permalink
- Report Inappropriate Content
What is the AMS operation mode ("Metrics Service operation mode" config) ?
Please share all the memory configs of AMS along with the memory in the node. The following configs will be useful.
In ams-env - metrics_collector_heapsize
In ams-hbase-env - hbase_regionserver_heapsize,hbase_master_maxperm_size, hbase_master_xmn_size, hbase_regionserver_heapsize, regionserver_xmn_size
and the output of "free -m"
Created 02-04-2016 02:43 AM
- Mark as New
- Bookmark
- Subscribe
- Mute
- Subscribe to RSS Feed
- Permalink
- Report Inappropriate Content
@Vitor Batista are you still having issues with this? Can you accept the best answer or post your solution?
- « Previous
-
- 1
- 2
- Next »


