Support Questions
- Cloudera Community
- Support
- Support Questions
- Re: Ambari metrics
- Subscribe to RSS Feed
- Mark Question as New
- Mark Question as Read
- Float this Question for Current User
- Bookmark
- Subscribe
- Mute
- Printer Friendly Page
- Subscribe to RSS Feed
- Mark Question as New
- Mark Question as Read
- Float this Question for Current User
- Bookmark
- Subscribe
- Mute
- Printer Friendly Page
Ambari metrics
- Labels:
-
Apache Ambari
-
HDFS
Created on 03-20-2017 02:46 AM - edited 09-16-2022 04:16 AM
- Mark as New
- Bookmark
- Subscribe
- Mute
- Subscribe to RSS Feed
- Permalink
- Report Inappropriate Content
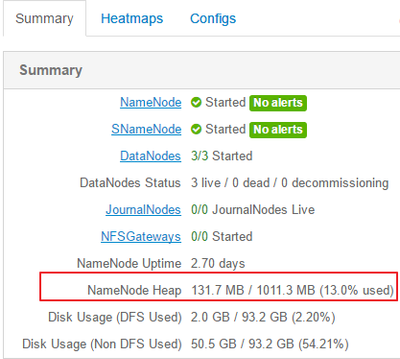
when i finish install the ambari , i view 'HDFS‘ in , in summary i can see “NameNode heap” data ,like this
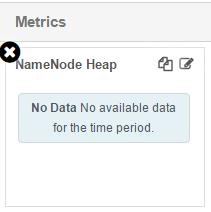
but under "Metrics" no graphic data .like this
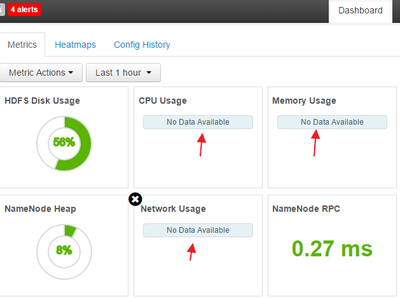
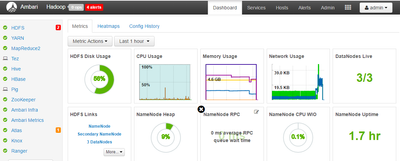
the same in "Dashboard", only memory usage,cpu usage,network
Created 03-20-2017 02:49 AM
- Mark as New
- Bookmark
- Subscribe
- Mute
- Subscribe to RSS Feed
- Permalink
- Report Inappropriate Content
Can you please check if the "metrics-monitor" component is running on all the hosts?
Please check:
# ps -ef | grep ^ams
ams      14933     1  0 02:50 ?        00:00:00 /usr/bin/python2.6 /usr/lib/python2.6/site-packages/resource_monitoring/main.py start
.
If it is not running then please start it and then check the Amabri UI again in few minutes.
Also please let us know which version of ambari is it? And do you see any error inside the following log?
# less /var/log//ambari-metrics-monitor/ambari-metrics-monitor.out (all hosts)
.
Also please check if the following file is pointing to correct AMS collector host & port.
# less /etc/ambari-metrics-monitor/conf/metric_monitor.ini
Created on 03-20-2017 02:58 AM - edited 08-18-2019 04:27 AM
- Mark as New
- Bookmark
- Subscribe
- Mute
- Subscribe to RSS Feed
- Permalink
- Report Inappropriate Content
yes, i checked them , they were all installed on three hosts.
Created 03-20-2017 03:04 AM
- Mark as New
- Bookmark
- Subscribe
- Mute
- Subscribe to RSS Feed
- Permalink
- Report Inappropriate Content
In the following log file do you see any error?
/var/log/ambari-metrics-collector/ambari-metrics-collector.log
.
What is the ambari server ambari metrics collector version? Is it same on all hosts? Are you seeing the same version for all AMS & ambari components?
# rpm -qa | grep ambari*
.
Created 03-20-2017 03:09 AM
- Mark as New
- Bookmark
- Subscribe
- Mute
- Subscribe to RSS Feed
- Permalink
- Report Inappropriate Content
If you have just added AMS to your cluster then the services need to be restarted to initiate the Sink. That is controlled by metrics properties file like:
# cat /etc/hadoop/conf/hadoop-metrics2.properties
Also in the NameNode (DataNode) logs do you see that the "Sink timeline started" is started as following:
# less /var/log/hadoop/hdfs/hadoop-hdfs-namenode-erie1.example.com.log

INFO  timeline.HadoopTimelineMetricsSink (HadoopTimelineMetricsSink.java:init(82)) - Initializing Timeline metrics sink.
INFO  timeline.HadoopTimelineMetricsSink (HadoopTimelineMetricsSink.java:init(100)) - Identified hostname = erie1.example.com, serviceName = namenode
INFO  timeline.HadoopTimelineMetricsSink (HadoopTimelineMetricsSink.java:init(118)) - Collector Uri: <a href="http://erie2.example.com:6188/ws/v1/timeline/metrics">http://erie2.example.com:6188/ws/v1/timeline/metrics</a>
INFO  timeline.HadoopTimelineMetricsSink (HadoopTimelineMetricsSink.java:init(166)) - RPC port properties configured: {8020=client}
NFO  impl.MetricsSinkAdapter (MetricsSinkAdapter.java:start(206)) - Sink timeline started
Created 03-20-2017 03:58 AM
- Mark as New
- Bookmark
- Subscribe
- Mute
- Subscribe to RSS Feed
- Permalink
- Report Inappropriate Content
thanks Jay very much !! yes ,i find an error in ambari-metrics-monitor.out
[WARNING] emitter.py:84 - Error sending metrics to server. [Errno 113] No route to host
it seems that metrics-collector host can't be connect ,but i don't know how to config this ? does it ok when i installed by ambari-server?
here is my hosts in '/etc/hosts' (all hosts are same)
192.168.2.43   bn-001.hadoop
192.168.2.39   bn-002.hadoop
192.168.2.38   bn-003.hadoop ( this is  ambari-metrics-collector)
here is “ metric_monitor.ini ” in my "metric collector host is "bn-001.hadoop"
[default]
debug_level = INFO
hostname = bn-001.hadoop
enable_time_threshold = false
enable_value_threshold = false

[emitter]
send_interval = 60


[collector]
collector_sleep_interval = 10
max_queue_size = 5000
host = bn-003.hadoop
port = 6188
https_enabled = False
Created 03-20-2017 05:04 AM
- Mark as New
- Bookmark
- Subscribe
- Mute
- Subscribe to RSS Feed
- Permalink
- Report Inappropriate Content
It is strange to see the following error:
[WARNING] emitter.py:84 - Error sending metrics to server. [Errno 113] No route to host
.
Which means the ambari metrics monitors are not able to communicate to AMS collector on the mentioned port. hence the data (memory/CPU ...etc) are not being emitted. Can you please check if from the metrics monitor host you are able to connect to AMS collector host/port (Just to see that there is no Firewall restriction on the port.)
# telnet bn-003.hadoop 6188
.
Also are the FQDNs correctly configured through out the cluster. So that you get the correct hostname in the following command output:
# hostname -f
.
Also please see: http://docs.hortonworks.com/HDPDocuments/Ambari-2.4.2.0/bk_ambari-installation/content/set_the_hostn...
and
Created on 03-20-2017 05:22 AM - edited 08-18-2019 04:27 AM
- Mark as New
- Bookmark
- Subscribe
- Mute
- Subscribe to RSS Feed
- Permalink
- Report Inappropriate Content
OK i fix it . My OS is 'Centos 7.1',
i alos used (Centos 6.*)
service iptables stop
So i change is with
systemctl stop firewalld
Every thing is ok Now , Thanks for Jay's help again.
