Support Questions
- Cloudera Community
- Support
- Support Questions
- Re: CM host/service monitor TS question
- Subscribe to RSS Feed
- Mark Question as New
- Mark Question as Read
- Float this Question for Current User
- Bookmark
- Subscribe
- Mute
- Printer Friendly Page
- Subscribe to RSS Feed
- Mark Question as New
- Mark Question as Read
- Float this Question for Current User
- Bookmark
- Subscribe
- Mute
- Printer Friendly Page
CM host/service monitor TS question
- Labels:
-
Cloudera Manager
Created on 10-28-2014 08:50 AM - edited 09-16-2022 02:10 AM
- Mark as New
- Bookmark
- Subscribe
- Mute
- Subscribe to RSS Feed
- Permalink
- Report Inappropriate Content
Hi,
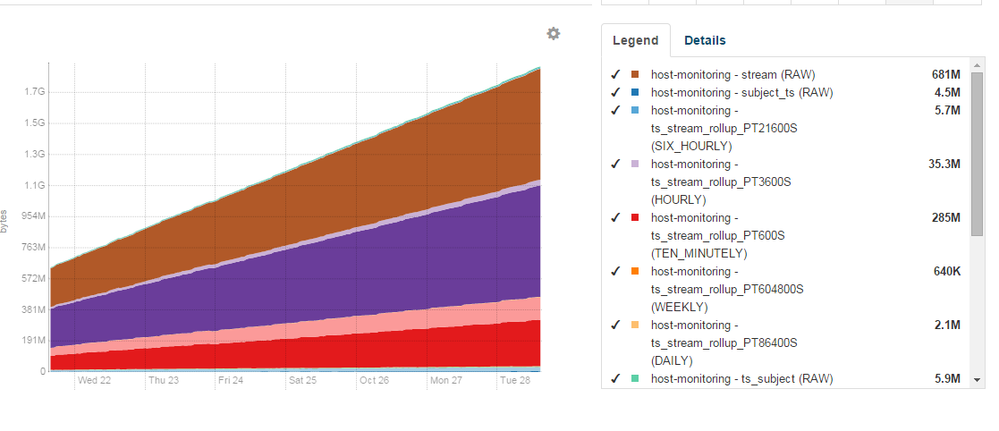
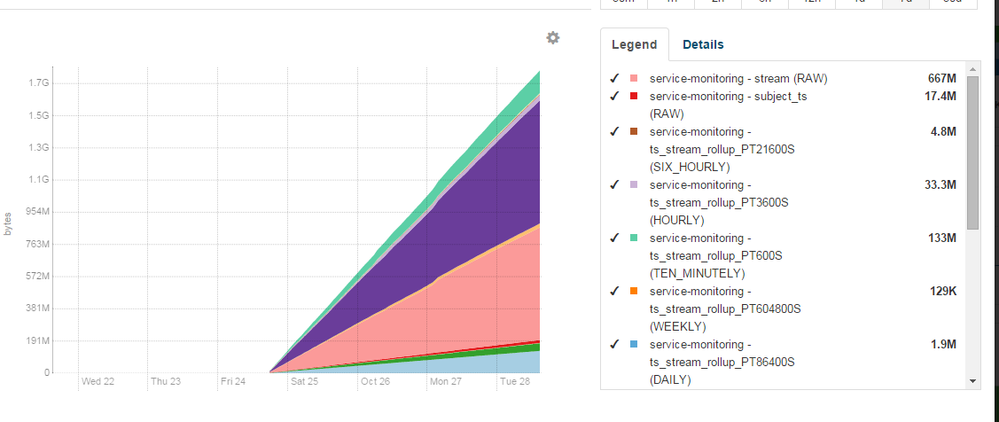
I have a 6 node cluster running in HA and noticed the growth rate of the TS data. I understand that the data storage for CM host/service monitor has a limit set which can be adjusted but is this normal for a HA cluster as for the rate of growth, considering that there are no jobs running in the cluster? Granted it will cap out at 10gb for each directory but is there a way to slow down the rate of consumption?
I saw an option in the CM manager "event publication log quiet time period" would this change the rate at which each "monitor storage directory" collects data?
Again, if this is normal and expected then I just need to ensure that there is enough overhead for the TS data to begin rolling.
Thanks
CM 5.2
Created 10-28-2014 09:05 AM
- Mark as New
- Bookmark
- Subscribe
- Mute
- Subscribe to RSS Feed
- Permalink
- Report Inappropriate Content
Hello Jy,
Per our other thread, these monitors are continually gathering metrics regardless of level of activity in the cluster. Let's consider:
Host Monitor (min. 10GiB)
- gathers metrics around node-level entities of interest (characteristics like disk space usage, RAM, CPU, etc)
-- Remember that these kinds of metrics are important and gathered/persisted regardless of the level of activity in the cluster. These metrics are still as useful in idle periods as they are in times of heavy load.
Service Monitor (min. 10GiB)
- gathers metrics around the configured roles and services in your cluster
-- similarly, these kinds of metrics are important and gathered/persisted regardless of the level of activity in the cluster.
-- These include metrics that would inform and power health checks like the HDFS, HBase, Zookeeper and Hive Canary functions to determine and notify early of any problems with same. Those are running constantly regardless of idle/use period, as they're always relevant.
The Service Monitor also has responsibility for gathering metrics around YARN Applications being run, and Impala Queries issued. There is dedicated space aside from the above 10GiB to Service Monitor. By default, the YARN Application and Impala Query segments each use and require a minimum of 1GiB each. THESE would indeed vary or grow/recycle depending on the rate of activity within the cluster, compared to the core Host and Service Monitor functionality.
That said, depending on how long you'd like to keep detailed metrics around YARN jobs or Impala Queries, do adjust that dedicated storage space upward if appropriate, and ensure it's located on a filesystem with adequate space to accommodate the size you specify.
Regards,
--
Mark S.
Created 04-02-2019 05:38 PM
- Mark as New
- Bookmark
- Subscribe
- Mute
- Subscribe to RSS Feed
- Permalink
- Report Inappropriate Content
hi,
Can i delete old data sitting in ts in cloudera-host/service monitors to retain some space ? the data was 4 years old.
please confirm me
Thanks
Yasmeen
Created 04-04-2019 01:27 AM
- Mark as New
- Bookmark
- Subscribe
- Mute
- Subscribe to RSS Feed
- Permalink
- Report Inappropriate Content
The minimum disk space limit for each of Host Monitor and Service Monitor is 10 Gb. If you are at this size or below, a cleanup does not make much sense as the disk space will be re-acquired over time.
The correct solution is to make sufficient disk space available for the /var/lib mountpoint.
If there is no other option then a short term help is to
- stop the Service Monitor role instance
- empty the data directory /var/lib/cloudera-service-monitor/
- start the Service Monitor role instance
Similar for the Host Monitor. Be aware this means all historical data showing up in the charts in CM will be lost with this method. Only monitoring data gathered after this procedure will be showing up.
Created 04-14-2019 08:02 PM
- Mark as New
- Bookmark
- Subscribe
- Mute
- Subscribe to RSS Feed
- Permalink
- Report Inappropriate Content
Thanks ton for your reply, few more clarifications -
Recently i came cross an issue where we have the partition metadata files under cloudera-host-monitor been zipped up and resulted in host monitor down for complete cluster. I rresolved this by unzipping all files.
What does cloudera[host-monitor/service-monitor] do while they restart? do they perform to read files under partition/partition metadata during statr?
as per your reply,
- empty the data directory /var/lib/cloudera-service-monitor/--- do i need to cleanup complete underlying directories under clouder-service-monitor? does it impact anything while starting service-monitor? We do have enough mountpoint of 50 GB, still i see files under ts sitting in CB's
Thanks
Yasmeen
Created 04-16-2019 11:23 PM
- Mark as New
- Bookmark
- Subscribe
- Mute
- Subscribe to RSS Feed
- Permalink
- Report Inappropriate Content
Zipping files in the directory effectively breaks the index thus Host Monitor (same for Service Monitor) is expected to fail during startup. Regarding your question, yes please totally empty that directory while Service Monitor is shut down. The next startup will initialize the directory with the new index files, no issues expected.
Created 04-19-2019 01:38 AM
- Mark as New
- Bookmark
- Subscribe
- Mute
- Subscribe to RSS Feed
- Permalink
- Report Inappropriate Content
Hello,
Thanks for your reply.
Before i cleanup from scratch dir for cloudera [host /service monitor] few more clarifications-
I see under subfolders of partitions/partition metadata there are few older files 2014, 2015 which showing up an amount of 2 GB, can i alone clean up these files? will it result in any failure during host/service monitor when they actually restart ?
Thanks
Yasmeen
Created 04-29-2019 12:20 AM
- Mark as New
- Bookmark
- Subscribe
- Mute
- Subscribe to RSS Feed
- Permalink
- Report Inappropriate Content
Sorry for the delay @yasmin
Not sure which files exactly you are referring to, but options are these are still valid data files from back then or they have been manually copied to there. You can easily verify with this procedure:
- Stop Service Monitor
- Make a backup of the whole data directory
- Delete the files in question
- Start Service Monitor
Then monitor the Service Monitor logs after startup. If you see any errors or issues reported then those files are needed, then please revert the above procedure and restore the data directory from the backup. If there are no errors then you are fine with the deleted files.
Created 05-03-2019 04:29 PM
- Mark as New
- Bookmark
- Subscribe
- Mute
- Subscribe to RSS Feed
- Permalink
- Report Inappropriate Content
Thank you gzigldrum
Ill follow the same below.Appreciate your time here!
Regards
Yasmeen


