Support Questions
- Cloudera Community
- Support
- Support Questions
- Re: Got 500 Error when trying to view status of a ...
- Subscribe to RSS Feed
- Mark Question as New
- Mark Question as Read
- Float this Question for Current User
- Bookmark
- Subscribe
- Mute
- Printer Friendly Page
- Subscribe to RSS Feed
- Mark Question as New
- Mark Question as Read
- Float this Question for Current User
- Bookmark
- Subscribe
- Mute
- Printer Friendly Page
Got 500 Error when trying to view status of a running mapreduce job
- Labels:
-
Apache Hadoop
-
MapReduce
-
Security
Created on 05-07-2015 11:03 PM - edited 09-16-2022 02:28 AM
- Mark as New
- Bookmark
- Subscribe
- Mute
- Subscribe to RSS Feed
- Permalink
- Report Inappropriate Content
We just launched our cluster with CDH5.3.3 on AWS, and We are currently testing our process on the new cluster.
Our job ran fine, but we ran into issues when we tried to view the actual status detail page of a running job.
We got HTTP 500 error when we either click on the 'Application Master' link on the Resource Manager UI page or by click on the link under 'Child Job Urls' tab when the job is running. We were able to get the job status page after it completed, but not while it was still running.
Is anyone know how to fix this issue? This is a real issue for us.
The detail error is listed below.
Thanks
HTTP ERROR 500
Problem accessing /. Reason:
    Guice configuration errors:

1) Could not find a suitable constructor in com.sun.jersey.guice.spi.container.servlet.GuiceContainer. Classes must have either one (and only one) constructor annotated with @Inject or a zero-argument constructor that is not private.
  at com.sun.jersey.guice.spi.container.servlet.GuiceContainer.class(GuiceContainer.java:108)
  while locating com.sun.jersey.guice.spi.container.servlet.GuiceContainer

1 error
Caused by:
com.google.inject.ConfigurationException: Guice configuration errors:

1) Could not find a suitable constructor in com.sun.jersey.guice.spi.container.servlet.GuiceContainer. Classes must have either one (and only one) constructor annotated with @Inject or a zero-argument constructor that is not private.
  at com.sun.jersey.guice.spi.container.servlet.GuiceContainer.class(GuiceContainer.java:108)
  while locating com.sun.jersey.guice.spi.container.servlet.GuiceContainer

1 error
	at com.google.inject.InjectorImpl.getBinding(InjectorImpl.java:113)
	at com.google.inject.InjectorImpl.getBinding(InjectorImpl.java:63)
	at com.google.inject.servlet.FilterDefinition.init(FilterDefinition.java:99)
	at com.google.inject.servlet.ManagedFilterPipeline.initPipeline(ManagedFilterPipeline.java:98)
	at com.google.inject.servlet.ManagedFilterPipeline.dispatch(ManagedFilterPipeline.java:114)
	at com.google.inject.servlet.GuiceFilter.doFilter(GuiceFilter.java:113)
	at org.mortbay.jetty.servlet.ServletHandler$CachedChain.doFilter(ServletHandler.java:1212)
	at org.apache.hadoop.http.HttpServer2$QuotingInputFilter.doFilter(HttpServer2.java:1224)
	at org.mortbay.jetty.servlet.ServletHandler$CachedChain.doFilter(ServletHandler.java:1212)
	at org.apache.hadoop.http.NoCacheFilter.doFilter(NoCacheFilter.java:45)
	at org.mortbay.jetty.servlet.ServletHandler$CachedChain.doFilter(ServletHandler.java:1212)
	at org.mortbay.jetty.servlet.ServletHandler.handle(ServletHandler.java:399)
	at org.mortbay.jetty.security.SecurityHandler.handle(SecurityHandler.java:216)
	at org.mortbay.jetty.servlet.SessionHandler.handle(SessionHandler.java:182)
	at org.mortbay.jetty.handler.ContextHandler.handle(ContextHandler.java:767)
	at org.mortbay.jetty.webapp.WebAppContext.handle(WebAppContext.java:450)
	at org.mortbay.jetty.handler.ContextHandlerCollection.handle(ContextHandlerCollection.java:230)
	at org.mortbay.jetty.handler.HandlerWrapper.handle(HandlerWrapper.java:152)
	at org.mortbay.jetty.Server.handle(Server.java:326)
	at org.mortbay.jetty.HttpConnection.handleRequest(HttpConnection.java:542)
	at org.mortbay.jetty.HttpConnection$RequestHandler.headerComplete(HttpConnection.java:928)
	at org.mortbay.jetty.HttpParser.parseNext(HttpParser.java:549)
	at org.mortbay.jetty.HttpParser.parseAvailable(HttpParser.java:212)
	at org.mortbay.jetty.HttpConnection.handle(HttpConnection.java:404)
	at org.mortbay.io.nio.SelectChannelEndPoint.run(SelectChannelEndPoint.java:410)
	at org.mortbay.thread.QueuedThreadPool$PoolThread.run(QueuedThreadPool.java:582)
Created 05-13-2015 05:33 PM
- Mark as New
- Bookmark
- Subscribe
- Mute
- Subscribe to RSS Feed
- Permalink
- Report Inappropriate Content
That symptoms sounds like YARN-3351 but the stack trace is not the same and that should have been fixed in the release you have also.
Can you give a bit more detail on where you saw the issue? Is this logged in the RM, do youhave HA for the RM etc. I can not really tell from this short snippet what is happening but this is not a known issue.
Wilfred
Created 05-13-2015 08:16 PM
- Mark as New
- Bookmark
- Subscribe
- Mute
- Subscribe to RSS Feed
- Permalink
- Report Inappropriate Content
Hi Wilfred,
Yes, it is logged in the RM, and I do have HA setup for RM. I do have HA setup for HDFS as well.
The job did show on the RM.
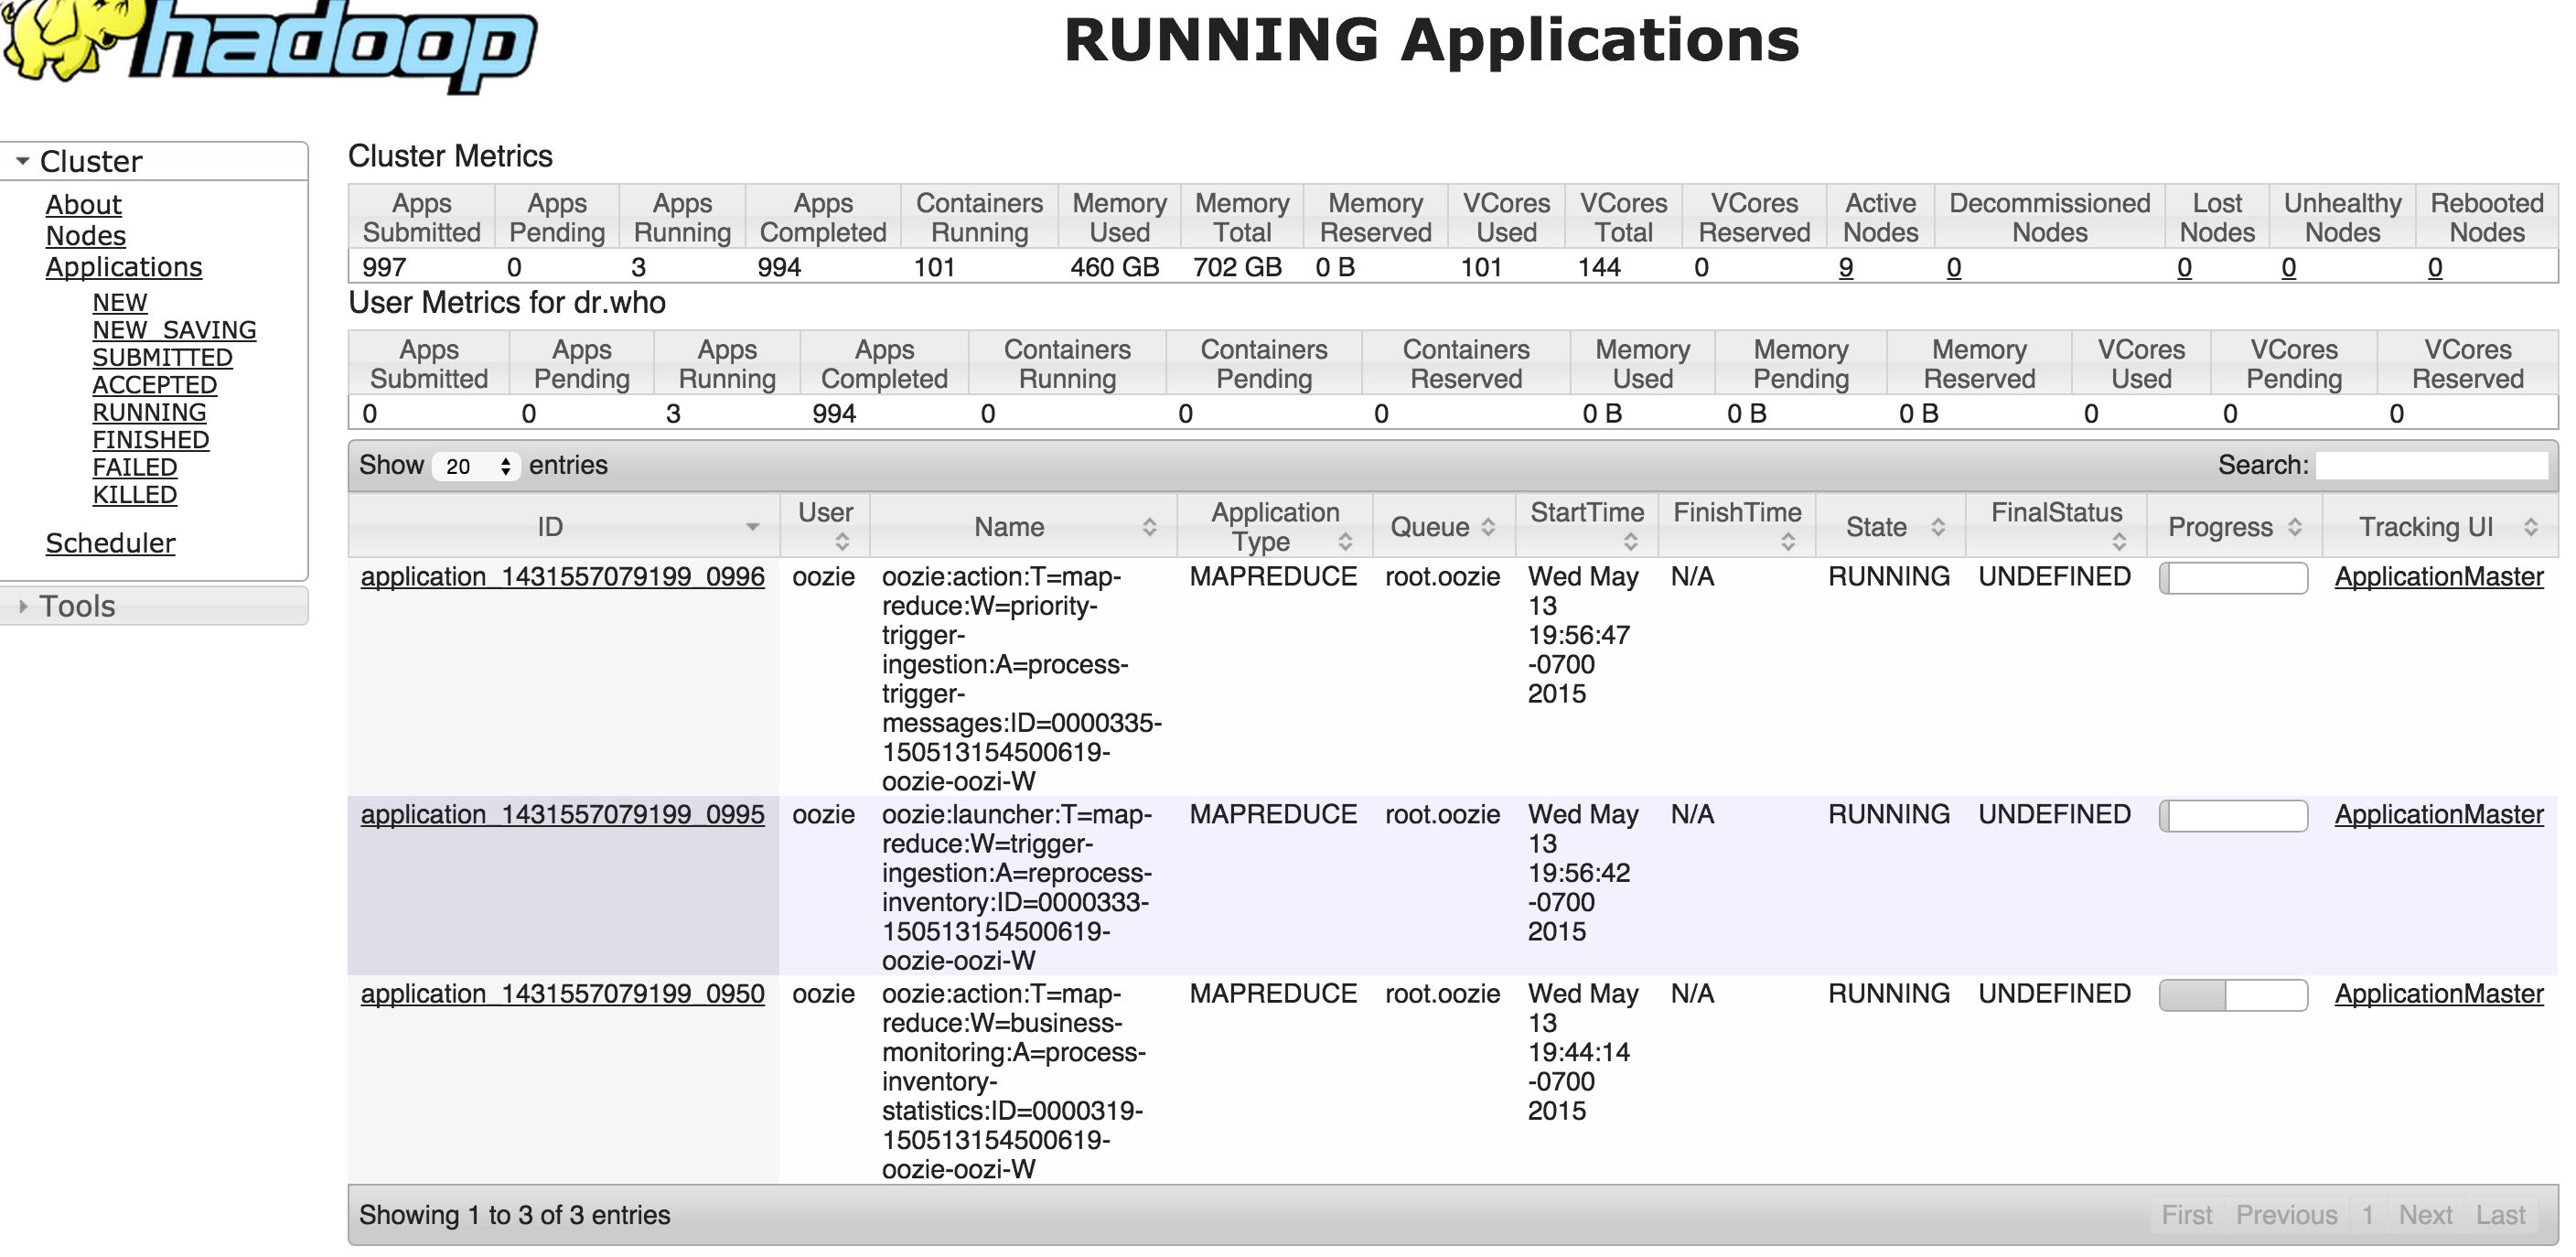
Below is a screen shot of RM UI page which listed all running job. When I clicked on the ApplicationMaster link for each job under Tracking UI column, the errors page was showned instead of the actual status page.
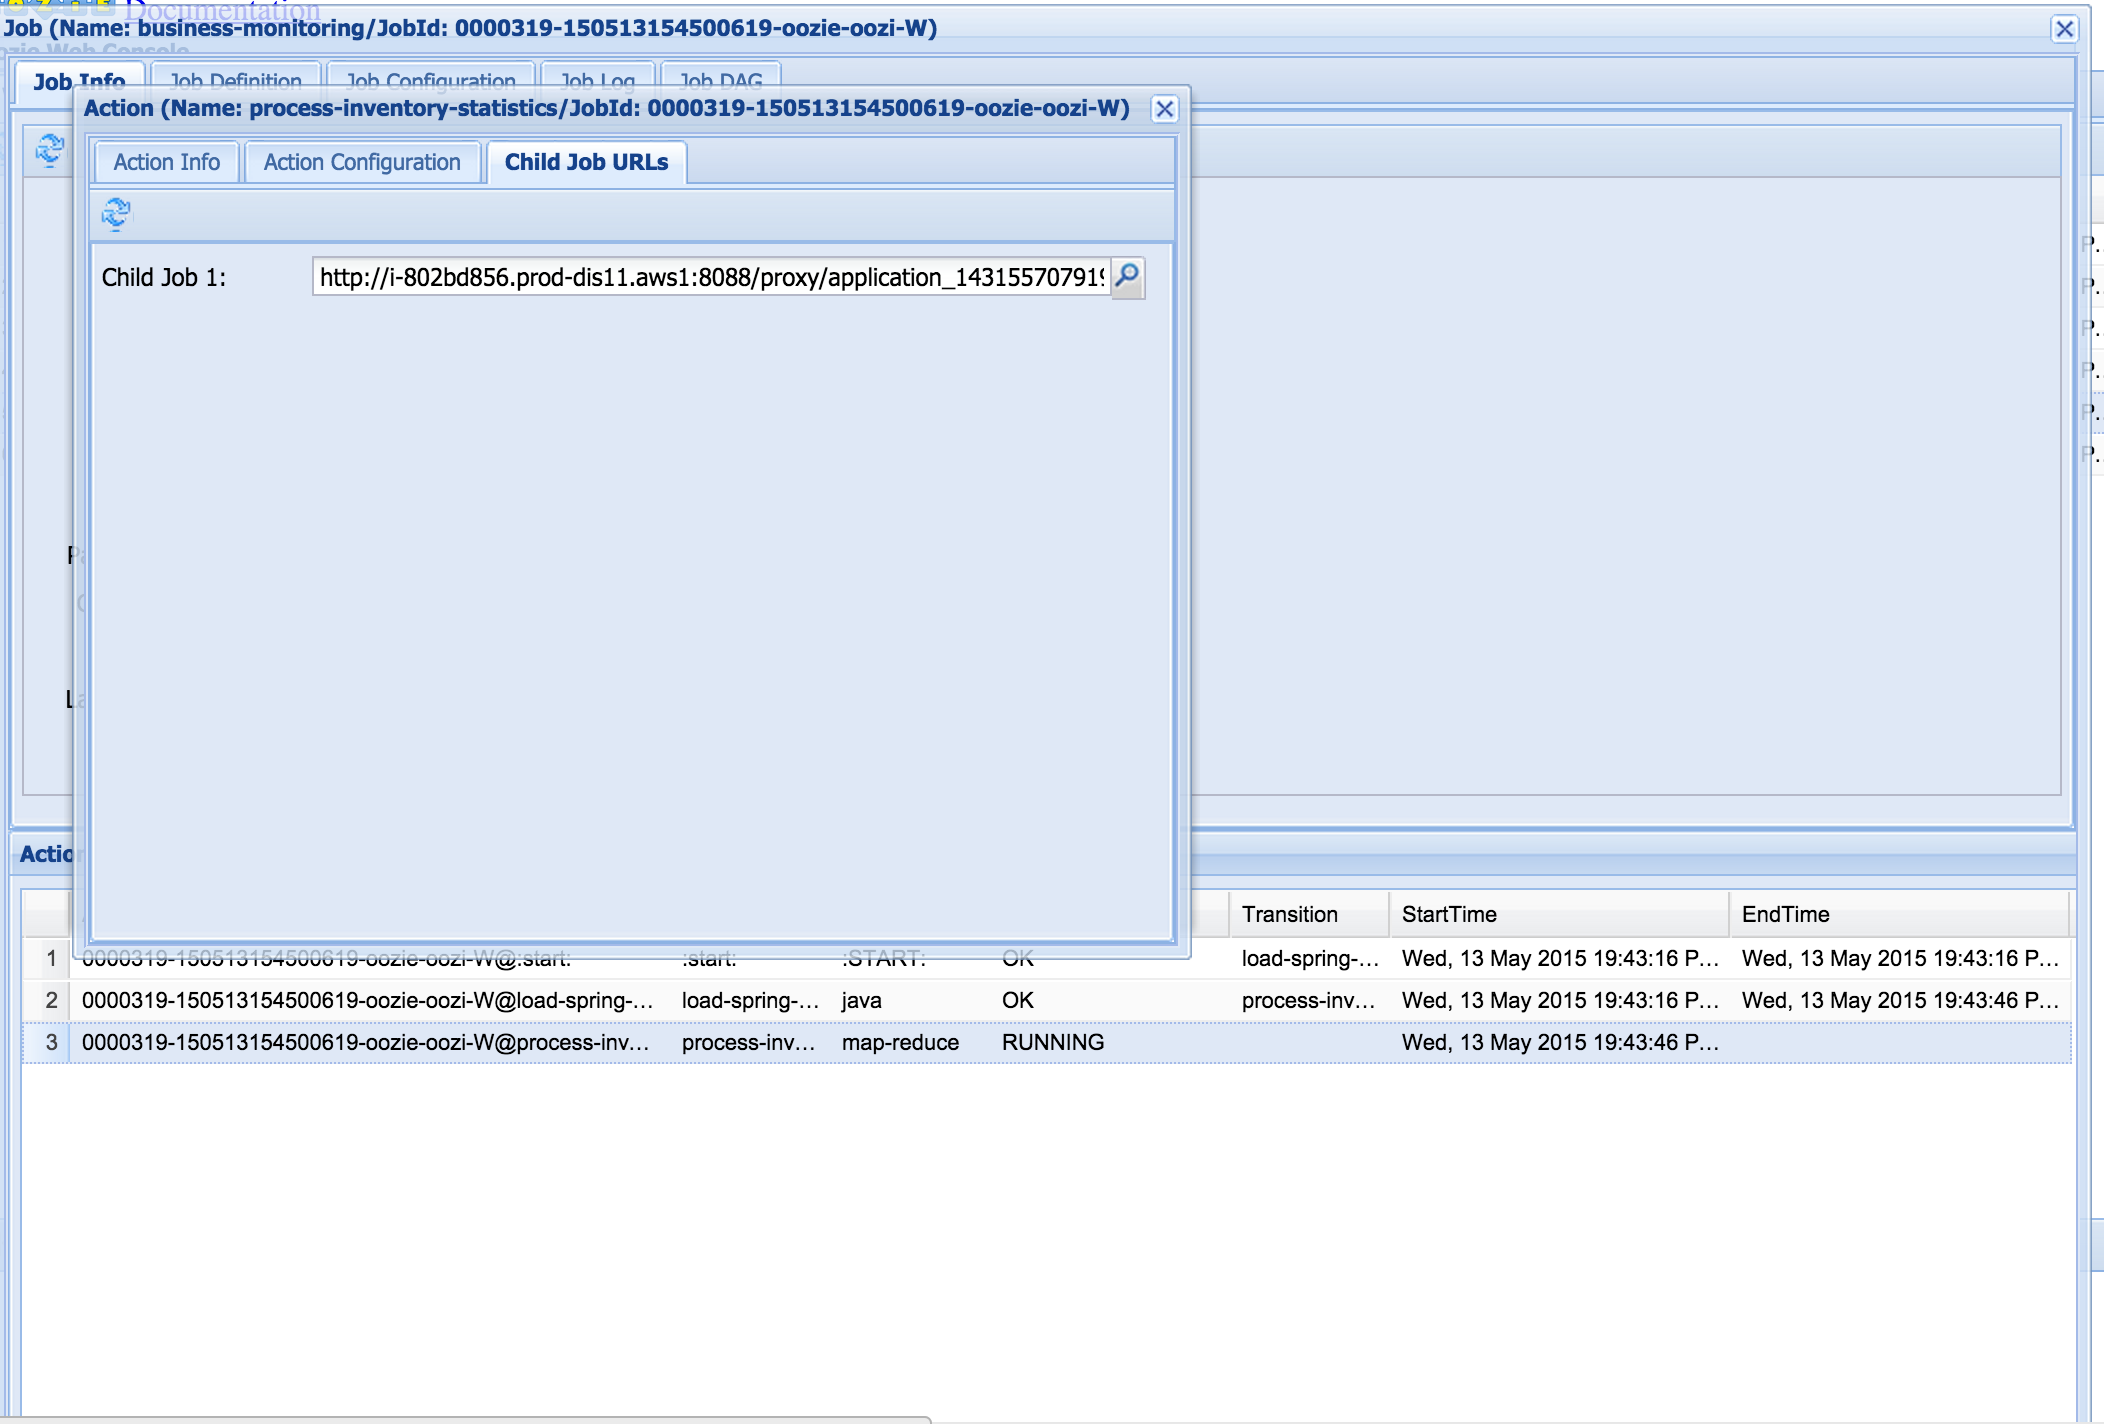
I also got the same errors if I click on search icon for Child Job 1: under the Child JOb Urls on Oozie UI.
Here is a screen shot of the oozie page.
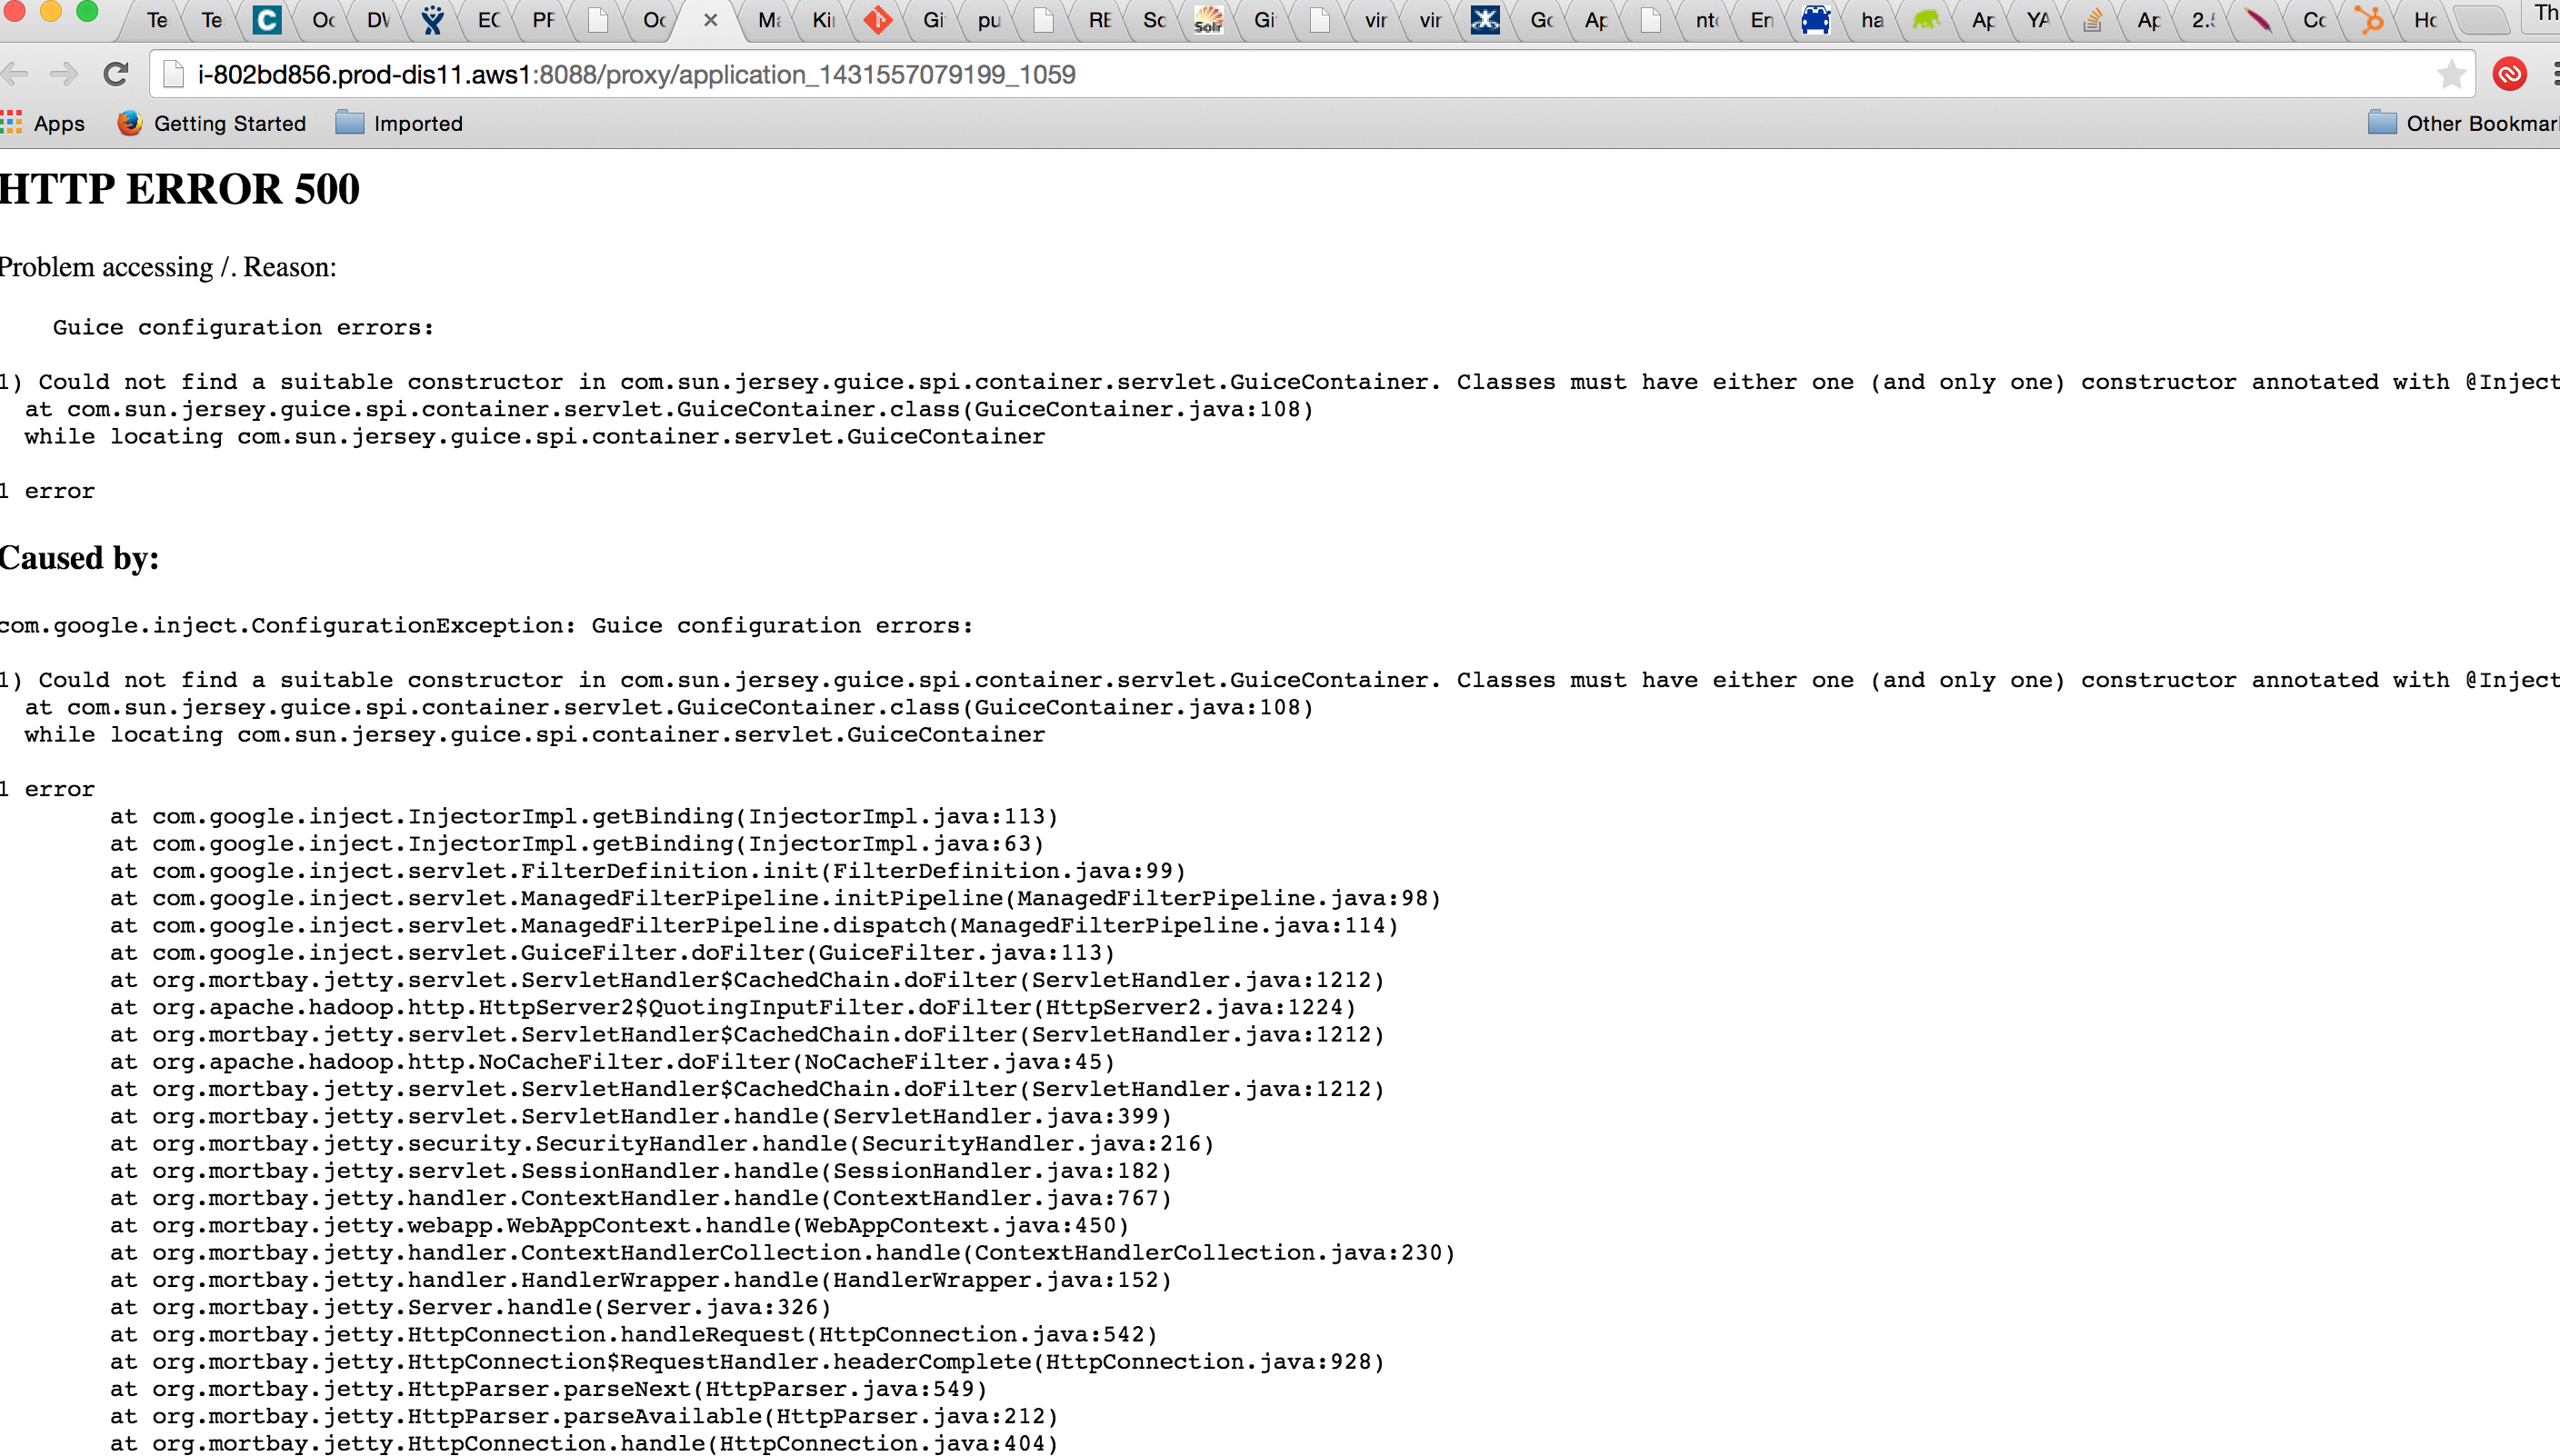
Here is the screen shoot for the error page:
I did could get to the status page find after the job completed, but not while it is still running.
Thank you very for your help.
Created 05-15-2015 12:52 AM
- Mark as New
- Bookmark
- Subscribe
- Mute
- Subscribe to RSS Feed
- Permalink
- Report Inappropriate Content
Please provide the log from the RM, showing the error and information before and after it.
This works for me without an issue in all my test clusters I have. If there is private information in it send it through a private message please.
Wilfred
Created 05-18-2015 09:04 AM
- Mark as New
- Bookmark
- Subscribe
- Mute
- Subscribe to RSS Feed
- Permalink
- Report Inappropriate Content
There were not much error from the resource manager log.
Whenever I click on the child url, there there message like this in the RM log. I ran the job with non oozie user, but it still happened if I ran it with oozie user.
The link try to access: http://i-802bd856.prod-dis11.aws1:8088/proxy/application_1431873888015_3748
Here is the partial log.
2015-05-18 08:41:37,237 INFO org.apache.hadoop.yarn.server.webproxy.WebAppProxyServlet: dr.who is accessing unchecked http://i-922ad944.prod-dis11.aws1:33802/ws/v1/mapreduce/jobs/job_1431873888015_3748 which is the app master GUI of application_1431873888015_3748 owned by inventory
2015-05-18 08:41:37,237 INFO org.apache.hadoop.yarn.server.webproxy.WebAppProxyServlet: dr.who is accessing unchecked http://i-9f2ad949.prod-dis11.aws1:47581/ws/v1/mapreduce/jobs/job_1431873888015_3758 which is the app master GUI of application_1431873888015_3758 owned by oozie
2015-05-18 08:41:43,844 INFO org.apache.hadoop.yarn.server.resourcemanager.rmapp.attempt.RMAppAttemptImpl: Updating application attempt appattempt_1431873888015_3758_000001 with final state: FINISHING, and exit status: -1000
2015-05-18 08:41:43,846 INFO org.apache.hadoop.yarn.server.webproxy.WebAppProxyServlet: dr.who is accessing unchecked http://i-922ad944.prod-dis11.aws1:33802/ which is the app master GUI of application_1431873888015_3748 owned by inventory
2015-05-18 08:41:43,846 INFO org.apache.hadoop.yarn.server.resourcemanager.rmapp.attempt.RMAppAttemptImpl: appattempt_1431873888015_3758_000001 State change from RUNNING to FINAL_SAVING
2015-05-18 08:41:43,846 INFO org.apache.hadoop.yarn.server.resourcemanager.rmapp.RMAppImpl: Updating application application_1431873888015_3758 with final state: FINISHING
2015-05-18 08:41:43,848 INFO org.apache.hadoop.yarn.server.resourcemanager.recovery.ZKRMStateStore: Watcher event type: NodeDataChanged with state:SyncConnected for path:/rmstore/ZKRMStateRoot/RMAppRoot/application_1431873888015_3758/appattempt_1431873888015_3758_000001 for Service org.apache.hadoop.yarn.server.resourcemanager.recovery.RMStateStore in state org.apache.hadoop.yarn.server.resourcemanager.recovery.RMStateStore: STARTED
I found some other people who had kind of similar message from log about (dr. who) and they were able to resolve by playing with hadoop.http.staticuser.user property or disable ACL. I tried to disabled by setting yarn.acl.enable = false, but I did not help.
Created 05-21-2015 09:36 AM
- Mark as New
- Bookmark
- Subscribe
- Mute
- Subscribe to RSS Feed
- Permalink
- Report Inappropriate Content
Hi Wilfred,
Have you had a chance to take a look with my update?
Thanks
Created 05-28-2015 03:21 AM
- Mark as New
- Bookmark
- Subscribe
- Mute
- Subscribe to RSS Feed
- Permalink
- Report Inappropriate Content
Hi, ttruong, did you found how to fix this error?
Created 05-28-2015 03:50 AM
- Mark as New
- Bookmark
- Subscribe
- Mute
- Subscribe to RSS Feed
- Permalink
- Report Inappropriate Content
Sorry, this slipt through the cracks. If you have already turned of the ACL then you should be able to get the logs via the command line.
Run yarn logs -applicationId <APPLICATION ID>
That should return the full log and also follow the normal process through all the proxies and checks to get the files and we should be able to hopefully tell what is going on in more detail.
Wilfred
Created 05-28-2015 02:56 PM
- Mark as New
- Bookmark
- Subscribe
- Mute
- Subscribe to RSS Feed
- Permalink
- Report Inappropriate Content
Hi Wilfred,
I really don't want to disable the ACL. I just tried to disable it to see it help to resolve the issue. I prefer to get the application log
using the UI instead of login to the host to retrieve the logs because not everyone has access to the host.
By the way, I just tried to retrive the log based on your suggestion by issue the command below, but it still did not work.
yarn logs -applicationId application_1432831904896_0149
I got this message:
15/05/28 14:51:17 INFO client.ConfiguredRMFailoverProxyProvider: Failing over to rm54
Application has not completed. Logs are only available after an application completes
Created 05-28-2015 06:07 PM
- Mark as New
- Bookmark
- Subscribe
- Mute
- Subscribe to RSS Feed
- Permalink
- Report Inappropriate Content
hello ttruong,
I had the same issue with you one month ago, but it was fixed by some operation(I did so many operations, I did not know which one fixed it).
And for the sevral weeks it worked fine. But yesterday, it didn't work any more, but I didn't do anything...
I guess it is something wrong with which permission of the log directory...
keep in touch
Linou


