Support Questions
- Cloudera Community
- Support
- Support Questions
- Re: HDP Cluster failed starting after high availab...
- Subscribe to RSS Feed
- Mark Question as New
- Mark Question as Read
- Float this Question for Current User
- Bookmark
- Subscribe
- Mute
- Printer Friendly Page
- Subscribe to RSS Feed
- Mark Question as New
- Mark Question as Read
- Float this Question for Current User
- Bookmark
- Subscribe
- Mute
- Printer Friendly Page
HDP Cluster failed starting after high availability installation
- Labels:
-
Hortonworks Data Platform (HDP)
Created 03-07-2017 04:03 PM
- Mark as New
- Bookmark
- Subscribe
- Mute
- Subscribe to RSS Feed
- Permalink
- Report Inappropriate Content
Hi,
Today I added high availability to my 4 vm servers cluster.
After adding high availability for name node Grafana failed to start.
Same repeated when for adding HA to resource manager.
I started failed services one by one after both occurrences.
After this I wanted to test cluster's health with HA feature and stopped all services, started all services.
In addition to failing Grafana, all of the services have alerts now.
My cluster information:
Ambari 2.4.2
HDP 2.5.3
CentOS 7.3.1611
Grafana start errors:
stderr:
Traceback (most recent call last):
  File "/var/lib/ambari-agent/cache/common-services/AMBARI_METRICS/0.1.0/package/scripts/metrics_grafana.py", line 69, in <module>
    AmsGrafana().execute()
  File "/usr/lib/python2.6/site-packages/resource_management/libraries/script/script.py", line 280, in execute
    method(env)
  File "/var/lib/ambari-agent/cache/common-services/AMBARI_METRICS/0.1.0/package/scripts/metrics_grafana.py", line 50, in start
    create_ams_datasource()
  File "/var/lib/ambari-agent/cache/common-services/AMBARI_METRICS/0.1.0/package/scripts/metrics_grafana_util.py", line 261, in create_ams_datasource
    (response.status, response.reason, data))
resource_management.core.exceptions.Fail: Ambari Metrics Grafana data source creation failed. POST request status: 401 Unauthorized
{"message":"Invalid username or password"}
stdout:
2017-03-07 18:38:36,664 - Execute['/usr/sbin/ambari-metrics-grafana start'] {'not_if': "ambari-sudo.sh su ams -l -s /bin/bash -c 'test -f /var/run/ambari-metrics-grafana/grafana-server.pid && ps -p `cat /var/run/ambari-metrics-grafana/grafana-server.pid`'", 'user': 'ams'}
2017-03-07 18:38:37,924 - Checking if AMS Grafana datasource already exists
2017-03-07 18:38:37,925 - Connecting (GET) to bigdev1:3000/api/datasources
2017-03-07 18:38:38,006 - Http response: 401 Unauthorized
2017-03-07 18:38:38,006 - Error checking for Ambari Metrics Grafana datasource. Will attempt to create.
2017-03-07 18:38:38,006 - Generating datasource:

{
  "name": "AMBARI_METRICS",
  "type": "ambarimetrics",
  "access": "proxy",
  "url": "http://bigdev3:6188",
  "password": "",
  "user": "",
  "database": "",
  "basicAuth": false,
  "basicAuthUser": "",
  "basicAuthPassword": "",
  "withCredentials": false,
  "isDefault": true,
  "jsonData": {}
}
2017-03-07 18:38:38,007 - Connecting (POST) to bigdev1:3000/api/datasources
2017-03-07 18:38:38,101 - Http response: 401 Unauthorized
2017-03-07 18:38:48,111 - Connection to Grafana failed. Next retry in 10 seconds.
2017-03-07 18:38:48,112 - Connecting (POST) to bigdev1:3000/api/datasources
2017-03-07 18:38:48,176 - Http response: 401 Unauthorized
Does anybody know the underlying reason of it?
Any comments appreciated...
Created on 03-07-2017 04:05 PM - edited 08-19-2019 01:05 AM
- Mark as New
- Bookmark
- Subscribe
- Mute
- Subscribe to RSS Feed
- Permalink
- Report Inappropriate Content
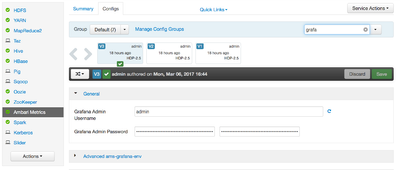
please double check the Grafana password @Sedat Kestepe looks like you're not providing username and password in your API call. You can find it in the configs section of Ambari Metrics Service
Fail: Ambari Metrics Grafana data source creation failed. POST request status: 401 Unauthorized {"message":"Invalid username or password"}
Created 03-08-2017 07:15 AM
- Mark as New
- Bookmark
- Subscribe
- Mute
- Subscribe to RSS Feed
- Permalink
- Report Inappropriate Content
Thanks @Artem Ervits!
Although I remember that I set all required passwords during the installation, I did set a password for Grafana. Now I can stop and start all services.


