Support Questions
- Cloudera Community
- Support
- Support Questions
- HandleHTTPRequest: Configure to process millions o...
- Subscribe to RSS Feed
- Mark Question as New
- Mark Question as Read
- Float this Question for Current User
- Bookmark
- Subscribe
- Mute
- Printer Friendly Page
- Subscribe to RSS Feed
- Mark Question as New
- Mark Question as Read
- Float this Question for Current User
- Bookmark
- Subscribe
- Mute
- Printer Friendly Page
HandleHTTPRequest: Configure to process millions of records
- Labels:
-
Apache NiFi
Created on 05-25-2017 05:55 AM - edited 08-18-2019 01:17 AM
- Mark as New
- Bookmark
- Subscribe
- Mute
- Subscribe to RSS Feed
- Permalink
- Report Inappropriate Content
I am facing difficulty in processing huge number of records at a time.
For example, using apache bench I am testing -c 1000 and -n 10000 which means 1000 users sending http requests to HandleHTTPRequest at same time. With just 1000 requests at a moment is giving me 504 erros/time our errors for requests. I tried just sending response as 200 as soon as I receive the request from HandleHTTPRequest but still I see the same issues. I wonder if Nifi supports deploying webservice that handles huge number of records.
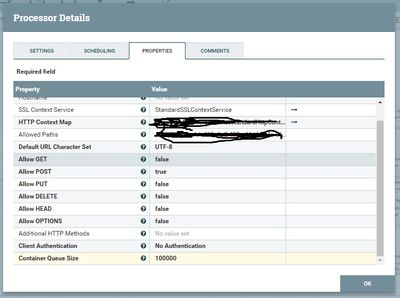
My Nifi configurations are as below
I would like to know if Nifi supports handling such kind of request as webserver. If so what would be the best configuration to handle huge number of records.
It would be great if anyone have benchmark results on HandleHTTPRequest processor configuration.
Created 05-25-2017 02:39 PM
- Mark as New
- Bookmark
- Subscribe
- Mute
- Subscribe to RSS Feed
- Permalink
- Report Inappropriate Content
So I'm assuming your flow is HandleHttpRequest -> HandleHttpResponse? Is the queue between them filling up and hitting back-pressure, or does it look like HandleHttpRequest is not processing requests fast enough.
For background, the way these processors work is the following...
- When HandleHttpRequest is started, it creates an embedded Jetty server with the default thread pool which I believe has 200 threads by default.
- When you send messages, the embedded Jetty server is handling them with the thread pool mentioned above, and placing them into an internal queue
- The internal queue size is based on the property in the processor 'Container Queue Size'
- When the processor executes, it is polling the queue to get one of the requests and creates a flow file with the content of the request and transfers it to the next processor
- The processor is executed by the number of concurrent tasks, in your case 100
- Then HandleHttpResponse will send the response back to the client
Here a couple of things to consider...
From your screenshots it shows you have 100 concurrent tasks set on HandleHttpRequest, this seems really high. Do you have servers that are powerful enough to support this? Have you increased the overall timer driven thread pool in NiFi to account for this?
From your screenshot it also shows that you are in a cluster, are you load balancing your requests across the NiFi nodes in the cluster? or are you sending all of them to only one node?
What do you have concurrent tasks set to on HandleHttpResponse?
Created 05-25-2017 06:06 PM
- Mark as New
- Bookmark
- Subscribe
- Mute
- Subscribe to RSS Feed
- Permalink
- Report Inappropriate Content
Your are right. I am just accepting the HTTP request and sending the response. Queue is not filling up, it is HandleHttpRequest not processing the requests fast enough. I was under an impression that HandleHttpRequest should be able to process upto the performance of Jetty server . But unable to see such performance.
Yes, I do have enough resources to process 100 concurrent tasks.
I haven't increased overall timer driven thread pool. I am new to this settings. I try to get context about these settings timer driven and event driven.
Yes, I am using load balancer Nginx to request across nodes in the Nifi cluster.
I am not sure if I get your last question correctly. I am just sending status 200 as Http response.
My bench mark sample results with 1000 concurrent results and total count of 10000 records are:
Load on standalone single: took about two minutes, no http timeouts
Load on all the node individually (i.e 10000 * 3 nodes): took about 45 mins. No http timeouts
Load on Nginx load balancer to use all Nifi nodes (just 1000 concurrent and 10000 records): took about 5 mins to process. I see timeout errors(504 status) as well from with Nginx.
I feel these results does not makes sense as apache and jetty kind of servers can process thousands of records in seconds. Please let me know your views.
Thank you for your prompt response and sharing your knowledge.
Awaiting for your reply.
Created on 05-25-2017 06:51 PM - edited 08-18-2019 01:17 AM
- Mark as New
- Bookmark
- Subscribe
- Mute
- Subscribe to RSS Feed
- Permalink
- Report Inappropriate Content
Keep in mind that the setting you apply are per node and not per cluster. So setting your concurrent task to 100 means that this processor on every node in you cluster has the ability to request up to 100 concurrent threads.
Does each node in your NIFi cluster have that many CPU cores?
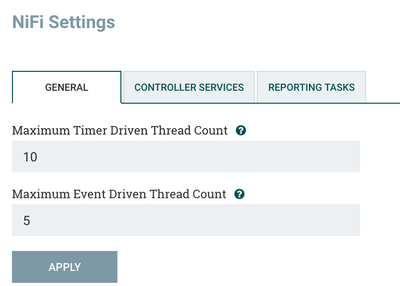
The concurrent tasks assigned to your processors pull threads from the "Maximum Timer Driven Thread Count" pool.
As you can see the default resource pool is rather low. So even if you do have the cores, If NiFi is not allowed to use them, this processor will never see 100 per node. Keep in mind that these setting are also per node. So for example: If you have a server with 16 cores, this setting should be set somewhere between 32 and 64. so your "concurrent tasks" set on a processor should not be set higher then this. Also keep in mind that if a processor does consume all available threads from the pool, none of your other processor will be able to run until that processor releases a thread back to the pool.
Thanks,
Matt
Created 05-25-2017 07:23 PM
- Mark as New
- Bookmark
- Subscribe
- Mute
- Subscribe to RSS Feed
- Permalink
- Report Inappropriate Content
As Matt pointed out, in order to make use of 100 concurrent tasks on a processor, you will need to increase Maximum Timer Driver Thread Count over 100. Also, as Matt pointed out, this would mean on each node you have this many threads available.
As far as general performance... the performance of a single request/response with Jetty depends on what is being done in the request/response. We can't just say "Jetty can process thousands of records in seconds" unless we know what is being done with those records in Jetty. If you deployed a WAR with a servlet that immediately returned 200, that performance would be a lot different than a servlet that had to take the incoming request and write it to a database, an external system, or disk.
With HandleHttpRequest/Response, each request becomes a flow file which means updates to the flow file repository and content repository, which means disk I/O, and then transferring those flow files to the next processor which reads them which means more disk I/O. I'm not saying this can't be fast, but there is more happening there than just a servlet that returns 200 immediately.
What I was getting with the last question was that if you have 100 concurrent tasks on HandleHttpRequest and 1 concurrent task on HandleHttpResponse, eventually the response part will become the bottle neck.


