Support Questions
- Cloudera Community
- Support
- Support Questions
- How to generate reports in NiFi ?
- Subscribe to RSS Feed
- Mark Question as New
- Mark Question as Read
- Float this Question for Current User
- Bookmark
- Subscribe
- Mute
- Printer Friendly Page
- Subscribe to RSS Feed
- Mark Question as New
- Mark Question as Read
- Float this Question for Current User
- Bookmark
- Subscribe
- Mute
- Printer Friendly Page
How to generate reports in NiFi ?
- Labels:
-
Apache MiNiFi
-
Apache NiFi
Created 03-04-2020 01:41 AM
- Mark as New
- Bookmark
- Subscribe
- Mute
- Subscribe to RSS Feed
- Permalink
- Report Inappropriate Content
We use NiFi mainly for file transfer, processing these files etc. The requirement is to pull reports from NiFi which has the statistics such as how many files were processed from NiFi, how many of them are successfully transferred to destination, how many are failed and waiting in different queues.
The NiFi rest api documentation(https://nifi.apache.org/docs/nifi-docs/rest-api/index.html) has the API's to pull this information, but i did not find any info on how to use these API's. Is the API's exposed out of the box or should it be enabled somehow.
Please share your suggestions on this.
If there is any other way to extract the data statistics from NiFi please share them as well.
Created 03-04-2020 10:55 AM
- Mark as New
- Bookmark
- Subscribe
- Mute
- Subscribe to RSS Feed
- Permalink
- Report Inappropriate Content
The API is exposed out of the box, it is not something you need to enable.
Every action you take while performing actions within the UI makes a call to the NiFi rest-api.
When learning how to use the rest-api calls, you may find using the developer tools in your browser helpful.
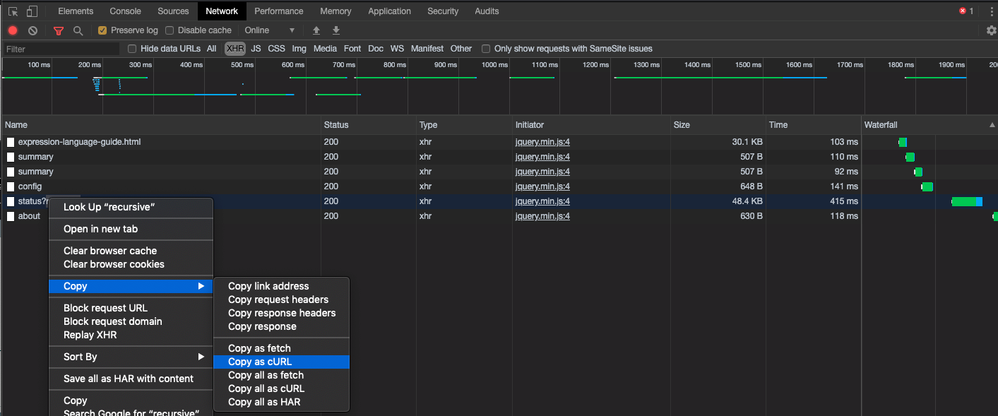
Open the developer tools while you are accessing your NiFi UI. Then perform some action and you will see those requests being made by your browser to NiFi. In the below example (Using Chrome browser developer tools), I opened NiFi's summary UI from the global menu in the upper right corner of the UI:
You'll notice that several requests were made. I can write click on any one of those request and select "Copy as cURL" to copy the full request to the system clipboard.
I can then paste the request in a terminal window and see what the rest-api call returns. You will notice that the curl command that is copied will have numerous additional headers (-H) that are not always necessary depending on the rest-api endpoint being used.
Example:
curl 'http://<nifi-hostname>:<nifi-port>/nifi-api/flow/process-groups/root/status?recursive=true'
Of course you will need to parse the rest-api returns yourself to extract in many cases the specific details/stats you want to monitor.
Hope this helps,
Matt


