Support Questions
- Cloudera Community
- Support
- Support Questions
- Re: How to interpret alerts in Ambari UI
- Subscribe to RSS Feed
- Mark Question as New
- Mark Question as Read
- Float this Question for Current User
- Bookmark
- Subscribe
- Mute
- Printer Friendly Page
- Subscribe to RSS Feed
- Mark Question as New
- Mark Question as Read
- Float this Question for Current User
- Bookmark
- Subscribe
- Mute
- Printer Friendly Page
How to interpret alerts in Ambari UI
- Labels:
-
Apache Ambari
-
Cloudera Manager
Created on 04-13-2018 07:59 PM - edited 08-17-2019 08:37 PM
- Mark as New
- Bookmark
- Subscribe
- Mute
- Subscribe to RSS Feed
- Permalink
- Report Inappropriate Content
I almost finished installing Hadoop cluster with Ambari, but still have some issues:
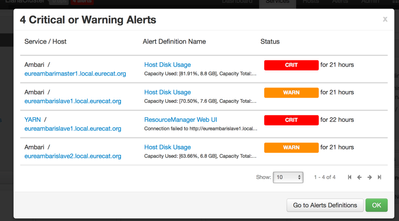
1) Some old alerts appear in the top header. When I click on them, I see that they refer to issues N hours ago. How can I delete these alerts and why do they still appear?
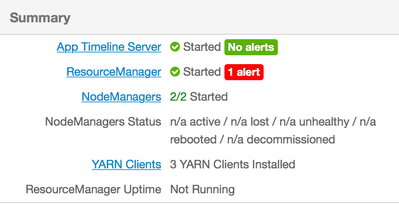
2) I have 1 alert next to Resource Manager, but when I check the date of this alert, I see "for 22 hours". I do not understand if it's something that happens now, or I should ignore these alerts.
Also, ResourceManager is installed and started in slave node 1. When I open xxx.xx.xx.xx:8088 in the browser, I do not see anything.
The port 8088 is opened and firewall is disabled. No other process is running on port 8088. What do I miss?
Created 04-13-2018 09:17 PM
- Mark as New
- Bookmark
- Subscribe
- Mute
- Subscribe to RSS Feed
- Permalink
- Report Inappropriate Content
Your disk usage alerts are still there because they are valid. They won't clear until you resolve the problem (adding more space to your hosts) or edit the alert and increase the threshold which triggers the alert.
The ResourceManager alert also seems real since you can't login to it and since the UI indicates it's not running. I would check the RM logs on that host to see why it's having problems.
Created 04-13-2018 09:22 PM
- Mark as New
- Bookmark
- Subscribe
- Mute
- Subscribe to RSS Feed
- Permalink
- Report Inappropriate Content
Thanks for your feedback. ResourceManager is only installed in Slave 1 (totally I have 1 master and 2 slaves). Where can I find the logs of RM?
According to the space, I attached volume to my nodes in OpenStack. However, I do not see the effect of this change. Is there something else I had to do?
Created 04-13-2018 09:32 PM
- Mark as New
- Bookmark
- Subscribe
- Mute
- Subscribe to RSS Feed
- Permalink
- Report Inappropriate Content
If it might be relevant: I tried to execute "yarn application -list" from master and hosts, but I get this error:
18/04/13 21:28:14 INFO ipc.Client: Retrying connect to server: eureambarislave1.local.eurecat.org/192.168.0.10:8050. Already tried 6 time(s); retry policy is RetryUpToMaximumCountWithFixedSleep(maxRetries=50, sleepTime=1000 MILLISECONDS)
Is it related to proxy settings of yarn?
Thanks.
Created 04-13-2018 09:37 PM
- Mark as New
- Bookmark
- Subscribe
- Mute
- Subscribe to RSS Feed
- Permalink
- Report Inappropriate Content
The disk usage alert runs every few minutes. If it hasn't cleared, then perhaps you didn't add enough storage. If you check the message, you can see why it thinks you don't have enough and you can verify your new mounts.
The logs would be in /var/log/hadoop/yarn on the ResourceManager host.
Created 04-13-2018 09:44 PM
- Mark as New
- Bookmark
- Subscribe
- Mute
- Subscribe to RSS Feed
- Permalink
- Report Inappropriate Content
I only have "hdfs" folder inside "/var/log/hadoop/". I checked all 3 nodes to be sure.
Created 04-16-2018 01:26 PM
- Mark as New
- Bookmark
- Subscribe
- Mute
- Subscribe to RSS Feed
- Permalink
- Report Inappropriate Content
Ah, sorry, try /var/log/hadoop-yarn/yarn


