Support Questions
- Cloudera Community
- Support
- Support Questions
- ImpalaRuntimeException: Unable to initialize the K...
- Subscribe to RSS Feed
- Mark Question as New
- Mark Question as Read
- Float this Question for Current User
- Bookmark
- Subscribe
- Mute
- Printer Friendly Page
- Subscribe to RSS Feed
- Mark Question as New
- Mark Question as Read
- Float this Question for Current User
- Bookmark
- Subscribe
- Mute
- Printer Friendly Page
ImpalaRuntimeException: Unable to initialize the Kudu scan node
- Labels:
-
Apache Impala
-
Apache Kudu
-
Cloudera
Created on
03-23-2022
07:02 AM
- last edited on
04-21-2026
12:58 AM
by
GrazittiAPI
- Mark as New
- Bookmark
- Subscribe
- Mute
- Subscribe to RSS Feed
- Permalink
- Report Inappropriate Content
Hi Cloudera gurús,
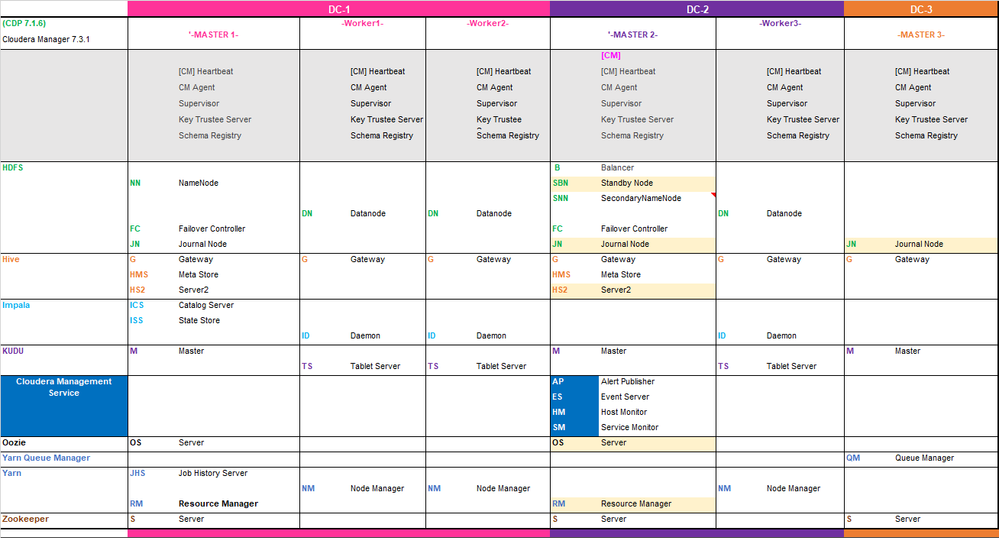
This is my CDP.
3 Master Nodes+3 Worker Nodes
HA enabled and testing it.
Here is the issue: when I shut down Master 2 some queries are randomly failing showing this:
# impala-shell -i haproxy-server.com -q "use dbschema; select * from table_foo limit 10;"
Starting Impala Shell without Kerberos authentication
Warning: live_progress only applies to interactive shell sessions, and is being skipped for now.
Opened TCP connection to haproxy-server.com:21000
Connected to haproxy-server.com:21000
Server version: impalad version 3.4.0-SNAPSHOT RELEASE (build 0cadcf7ac76ecec87d9786048db3672c37d41c6f)
Query: use dbschema
Query: select * from table_foo limit 10
Query submitted at: 2022-03-23 11:28:37 (Coordinator: http://worker1:25000)
ERROR: ImpalaRuntimeException: Unable to initialize the Kudu scan node
CAUSED BY: AnalysisException: Unable to open the Kudu table: dbschema.table_foo
CAUSED BY: NonRecoverableException: cannot complete before timeout: KuduRpc(method=GetTableSchema, tablet=Kudu Master, attempt=1, TimeoutTracker(timeout=180000, elapsed=180004), Trace Summary(0 ms): Sent(1), Received(0), Delayed(0), MasterRefresh(0), AuthRefresh(0), Truncated: false
Sent: (master-192.168.1.10:7051, [ GetTableSchema, 1 ]))

Could not execute command: select * from table_foo limit 10
The thing is that all leaders are correctly re-balanced to other nodes and something is working, because most queries are working.
Does someone have any clue? I was thinking about Hive server but not sure how to trace it.
Note: as CM is in Master2, this is unavailable (this is not affecting, some different tests have been done having CM out of service and queries were working fine)
Note2: does it affects that the kudu Master were in Master2?
Many thanks in advance for your help.
Best Regards
Created 03-24-2022 01:33 AM
- Mark as New
- Bookmark
- Subscribe
- Mute
- Subscribe to RSS Feed
- Permalink
- Report Inappropriate Content
Hello @Juanes ,
Could you please check the
ksck report
ksck report from kudu, Please if you have any unhealthy tables also verify the replicas as well.
Please refer doc[1]
doc[1]:
https://kudu.apache.org/docs/administration.html#tablet_majority_down_recovery
Thanks,
Created 03-24-2022 05:44 AM
- Mark as New
- Bookmark
- Subscribe
- Mute
- Subscribe to RSS Feed
- Permalink
- Report Inappropriate Content
Hello ,
the ksck is showing that tables are OK (Recovering | Under-replicated | Unavailable are all = 0)
W0324 12:15:41.325619 18080 negotiation.cc:313] Failed RPC negotiation. Trace:
Tablet Replica Count Summary
Statistic | Replica Count
----------------+---------------
Minimum | 1450
First Quartile | 1450
Median | 1450
Third Quartile | 1450
Maximum | 1450
Total Count Summary
| Total Count
----------------+-------------
Masters | 3
Tablet Servers | 3
Tables | 109
Tablets | 1450
Replicas | 4350
==================
Warnings:
==================
master unusual flags check error: 1 of 3 masters were not available to retrieve unusual flags
master diverged flags check error: 1 of 3 masters were not available to retrieve time_source category flags
==================
Errors:
==================
Network error: error fetching info from masters: failed to gather info from all masters: 1 of 3 had errors
Corruption: master consensus error: there are master consensus conflicts
That I have no clear is why I'm having a consensus error if I have 2of3 Master UP and all 3 Tablet servers UP
Created 03-30-2022 01:53 AM
- Mark as New
- Bookmark
- Subscribe
- Mute
- Subscribe to RSS Feed
- Permalink
- Report Inappropriate Content
Hello,
does anyone knows if exists any table reference with the errors?
Just wanted to know what it means : Unable to initialize the Kudu scan node
no relevant traces found in the following logs:
Impala Daemon
Impala Catalog Server
Impala State Store
Kudu Master Leader
Kudu tablet
Hive Metastore
Hive Server2
I'm getting out of resources 😞
Created 08-24-2022 12:56 AM
- Mark as New
- Bookmark
- Subscribe
- Mute
- Subscribe to RSS Feed
- Permalink
- Report Inappropriate Content
Hello,
it seems the main error is related to Impala, Kudu is balancing and responding well during the tests, the issue is that Impala breaks the connection to whoever that inform where the new Kudu Master LEADER is. I'm suspicious about the Cloudera Management services that are already down.
Will update the solution whenever I have it.


