Support Questions
- Cloudera Community
- Support
- Support Questions
- Re: Kudu Tablet Server - Leak Memory ?
- Subscribe to RSS Feed
- Mark Question as New
- Mark Question as Read
- Float this Question for Current User
- Bookmark
- Subscribe
- Mute
- Printer Friendly Page
- Subscribe to RSS Feed
- Mark Question as New
- Mark Question as Read
- Float this Question for Current User
- Bookmark
- Subscribe
- Mute
- Printer Friendly Page
Kudu Tablet Server - Leak Memory ?
- Labels:
-
Apache Kudu
Created on 09-28-2018 02:59 AM - edited 09-16-2022 06:45 AM
- Mark as New
- Bookmark
- Subscribe
- Mute
- Subscribe to RSS Feed
- Permalink
- Report Inappropriate Content
Hi,
We have done some successful tests on Kudu for a few months with the following configuration:
Cluster Test - A
*3 Kudu Masters
*3 Tablet Servers
*Sentry+Kerberos enabled in the cluster
*Ubuntu 14.04
*Kudu 1.5.0
After that, we would like to put in production in our system
Cluster Production - B
*Same configuration in cluster A
*Ubuntu 16.04
*Kudu 1.7
But we are currently experiencing memory errors we never had before on the Cluster A.
After querying on a small table (700k rows and 30 columns), all the tablet servers have their memory full but the peak never goes back down, and we can't figure out where does it comes from.
So we can't insert new rows etc.
The only way we find to empty memory was to restart kudu ...
Our memory configuration:
memory_limit_hard_bytes = 4GB
block_cache_capacity_mb = 512MB
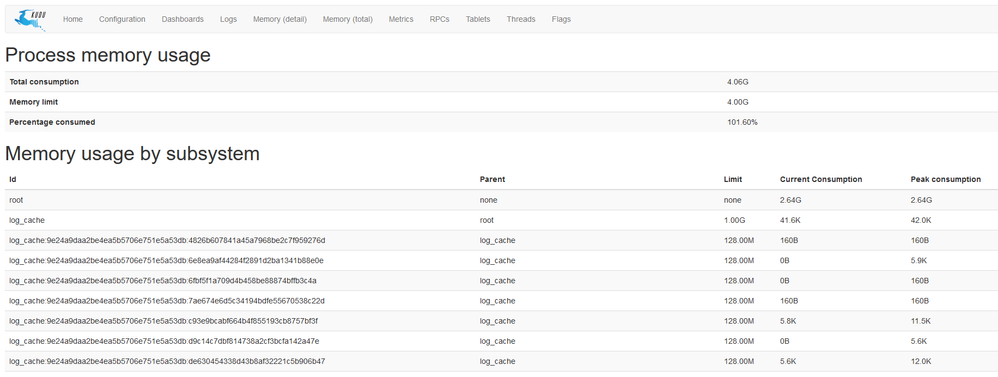
For example after a query, the memory of a tablet server:
And in the log of a tablet server:
We have also tried to debug memory usage by using gperftools, but a bit complicated to understand (I can send the svg files if needed)
There are also a similar problem in the link below, but we didn't find any solutions
https://issues.apache.org/jira/browse/KUDU-1762
Do you have any ideas ? Are we missing something ?
Thank you in advance,
Vincent
Created 10-18-2018 11:05 AM
- Mark as New
- Bookmark
- Subscribe
- Mute
- Subscribe to RSS Feed
- Permalink
- Report Inappropriate Content
Created 09-28-2018 07:28 AM
- Mark as New
- Bookmark
- Subscribe
- Mute
- Subscribe to RSS Feed
- Permalink
- Report Inappropriate Content
Hi Vincent. The heap profiles would be very useful. You can find instructions on how to gather them at http://kudu.apache.org/docs/troubleshooting.html#heap_sampling.
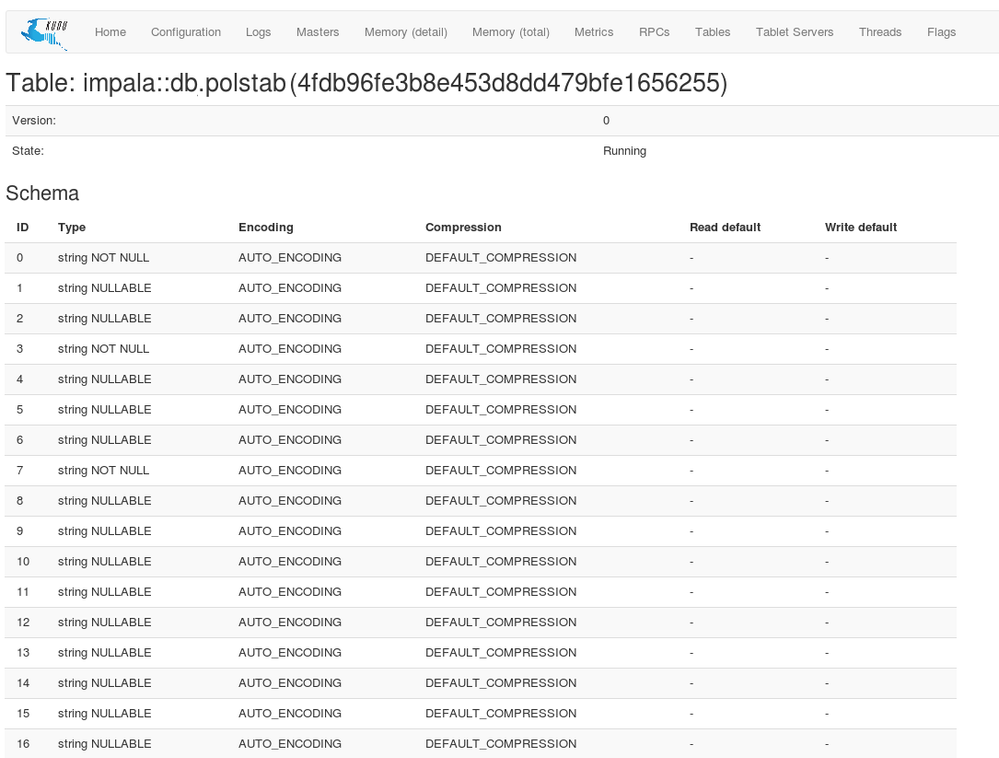
Also, could you provide more detail on what you did to trigger the memory issue? The schema of the table, including the column encoding and compression types, plus the query, might be helpful too. You can find the schema on the page for the table, accessible through the leader master's web UI.
Created 10-01-2018 01:55 AM
- Mark as New
- Bookmark
- Subscribe
- Mute
- Subscribe to RSS Feed
- Permalink
- Report Inappropriate Content
Hi,
Many thanks for your answer.
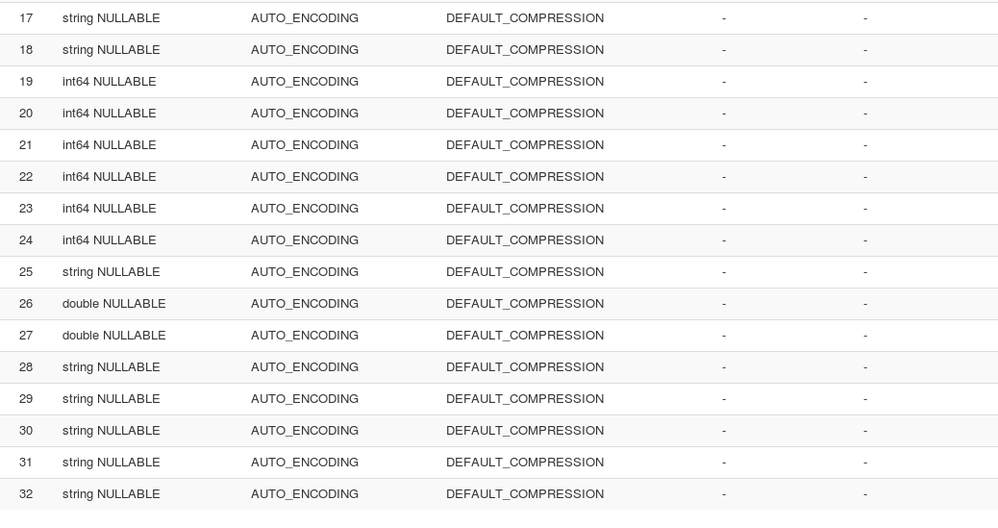
Below is the schema of the table.
The memory issue happens for any kind of queries, for example:
-select * from table ORDER BY column_string ASC
-select * from table WHERE column_string = 'abc'
But even at rest, the RAM consumption is about 2.6/4G for this table of 700k rows (with a total tablet size of 8 G) it seems abnormal.
Below are the links to the svg files:
https://sendeyo.com/up/d/96b96e542a (Kudu Tablet Server at rest)
https://sendeyo.com/up/d/752e5b1b98 (Kudu Tablet Server after a query)
Thank you in advance,
Vincent
Created 10-01-2018 10:50 AM
- Mark as New
- Bookmark
- Subscribe
- Mute
- Subscribe to RSS Feed
- Permalink
- Report Inappropriate Content
The best thing to do immediately is allocated more memory to Kudu. 4GB is not very much.
Another thing that might help investigate further is to get the scan trace metrics for a scan. They will be on the /rpcz page after you run a scan.
Finally, when you make these memory measurements, is your application holding the scanner open? The 600MB allocated for the scanner but not in the block cache should be released when the scanner is closed. The 900MB in the block cache will be evicted if new blocks need to be cached.
Created 10-05-2018 10:02 AM
- Mark as New
- Bookmark
- Subscribe
- Mute
- Subscribe to RSS Feed
- Permalink
- Report Inappropriate Content
Hello,
Thank you for your answer.
We have check, the block_cache_capacity_mb is 512 MiB. And below is an example of scan trace metrics :
"trace": "1004 15:36:51.672528 (+ 0us) service_pool.cc:163] Inserting onto call queue\n1004 15:36:51.672553 (+ 25us) service_pool.cc:222] Handling call\n1004 15:36:51.673895 (+ 1342us) inbound_call.cc:157] Queueing success response\nRelated trace 'txn':\n1004 15:36:51.672634 (+ 0us) write_transaction.cc:101] PREPARE: Starting\n1004 15:36:51.672651 (+ 17us) write_transaction.cc:268] Acquiring schema lock in shared mode\n1004 15:36:51.672652 (+ 1us) write_transaction.cc:271] Acquired schema lock\n1004 15:36:51.672652 (+ 0us) tablet.cc:400] PREPARE: Decoding operations\n1004 15:36:51.672662 (+ 10us) tablet.cc:422] PREPARE: Acquiring locks for 1 operations\n1004 15:36:51.672666 (+ 4us) tablet.cc:426] PREPARE: locks acquired\n1004 15:36:51.672666 (+ 0us) write_transaction.cc:126] PREPARE: finished.\n1004 15:36:51.672674 (+ 8us) write_transaction.cc:136] Start()\n1004 15:36:51.672675 (+ 1us) write_transaction.cc:141] Timestamp: P: 1538667411672672 usec, L: 0\n1004 15:36:51.672694 (+ 19us) log.cc:582] Serialized 1538 byte log entry\n1004 15:36:51.673861 (+ 1167us) write_transaction.cc:149] APPLY: Starting\n1004 15:36:51.673876 (+ 15us) tablet_metrics.cc:365] ProbeStats: bloom_lookups=0,key_file_lookups=0,delta_file_lookups=0,mrs_lookups=0\n1004 15:36:51.673879 (+ 3us) log.cc:582] Serialized 25 byte log entry\n1004 15:36:51.673886 (+ 7us) write_transaction.cc:309] Releasing row and schema locks\n1004 15:36:51.673888 (+ 2us) write_transaction.cc:277] Released schema lock\n1004 15:36:51.673889 (+ 1us) write_transaction.cc:196] FINISH: updating metrics\n1004 15:36:51.673918 (+ 29us) write_transaction.cc:309] Releasing row and schema locks\n1004 15:36:51.673919 (+ 1us) write_transaction.cc:277] Released schema lock\n",
But nothing seems to be anormal ?
For the scanner we use impala via HUE, and when we check on Cloudera Manager the query state is "FINISHED" so I think that the scanner must be closed.
Is there a way to track the block cache or how to refresh it?
In fact we have removed this table and we are trying to reproduce the same situation.
But we have noticed that when we fill the table, the tablet server memory keep increasing (slowly) over time. To fill the table, we have a loop open on Kafka and with impyla we insert new messages into Kudu. And once again, to get Kudu tablet server "default" memory we have to restart Kudu.
We are trying to see if it's because we don't close impyla cursor, but are we missing something else?
Thank you in advance,
Vincent
Created 10-05-2018 01:58 PM
- Mark as New
- Bookmark
- Subscribe
- Mute
- Subscribe to RSS Feed
- Permalink
- Report Inappropriate Content
{
"method_name": "kudu.tserver.ScanRequestPB",
"samples": [
{
"header": {
"call_id": 7,
"remote_method": {
"service_name": "kudu.tserver.TabletServerService",
"method_name": "Scan"
},
"timeout_millis": 29999
},
"trace": "1005 10:27:46.216542 (+ 0us) service_pool.cc:162] Inserting onto call queue\n1005 10:27:46.216573 (+ 31us) service_pool.cc:221] Handling call\n1005 10:27:46.216712 (+ 139us) tablet_service.cc:1796] Created scanner 9c3aaa87517f4832aa81ff0dc0d71284 for tablet 42483058124f48c685943bef52f3b625\n1005 10:27:46.216839 (+ 127us) tablet_service.cc:1872] Creating iterator\n1005 10:27:46.216874 (+ 35us) tablet_service.cc:2209] Waiting safe time to advance\n1005 10:27:46.216894 (+ 20us) tablet_service.cc:2217] Waiting for operations to commit\n1005 10:27:46.216917 (+ 23us) tablet_service.cc:2231] All operations in snapshot committed. Waited for 32 microseconds\n1005 10:27:46.216937 (+ 20us) tablet_service.cc:1902] Iterator created\n1005 10:27:46.217231 (+ 294us) tablet_service.cc:1916] Iterator init: OK\n1005 10:27:46.217250 (+ 19us) tablet_service.cc:1965] has_more: true\n1005 10:27:46.217258 (+ 8us) tablet_service.cc:1980] Continuing scan request\n1005 10:27:46.217291 (+ 33us) tablet_service.cc:2033] Found scanner 9c3aaa87517f4832aa81ff0dc0d71284 for tablet 42483058124f48c685943bef52f3b625\n1005 10:27:46.218143 (+ 852us) inbound_call.cc:162] Queueing success response\n",
"duration_ms": 1,
"metrics": [
{
"key": "rowset_iterators",
"value": 1
},
{
"key": "threads_started",
"value": 1
},
{
"key": "thread_start_us",
"value": 64
},
{
"key": "compiler_manager_pool.run_cpu_time_us",
"value": 117013
},
{
"key": "compiler_manager_pool.run_wall_time_us",
"value": 127378
},
{
"key": "compiler_manager_pool.queue_time_us",
"value": 114
}
]
}
]
},
The profile is pointing to this server having a lot of data blocks. What is your workload like? Does it involve a lot of updates and deletes? How many tablet replicas are on this server?
Attaching the output of the following commands will help investigate further. All should be run on the tablet server where you're seeing the memory problem:
sudo -u kudu kudu fs check --fs_wal_dir=<wal dir> --fs_data_dirs=<data dirs>
This should be fine to run while the server is running. You'll see a benign error message about not being able to acquire a lock and proceeding in read only mode.
sudo -u kudu kudu local_replica data_size <tablet id> --fs_wal_dir=<wal dir> --fs_data_dirs=<data dirs>
Try running this for a few tablets of your most active tables.
Created on 10-08-2018 05:53 AM - edited 10-08-2018 05:55 AM
- Mark as New
- Bookmark
- Subscribe
- Mute
- Subscribe to RSS Feed
- Permalink
- Report Inappropriate Content
Hello,
Thank you for your answer.
Below is a scan RPC trace:
"method_name": "kudu.tserver.ScanRequestPB",
"samples": [
{
"header": {
"call_id": 1421646,
"remote_method": {
"service_name": "kudu.tserver.TabletServerService",
"method_name": "Scan"
},
"timeout_millis": 179999
},
"trace": "1008 12:09:55.490616 (+ 0us) service_pool.cc:163] Inserting onto call queue\n1008 12:09:55.490648 (+ 32us) service_pool.cc:222] Handling call\n1008 12:09:55.490657 (+ 9us) tablet_service.cc:1901] Found scanner 4f0b899b9c7d469a942854dfe3e1d921\n1008 12:09:55.494442 (+ 3785us) inbound_call.cc:157] Queueing success response\n",
"duration_ms": 3,
"metrics": [
{
"key": "cfile_cache_miss",
"value": 455
},
{
"key": "cfile_cache_miss_bytes",
"value": 402982
},
{
"key": "lbm_reads_lt_1ms",
"value": 455
},
{
"key": "lbm_read_time_us",
"value": 889
},
{
"key": "spinlock_wait_cycles",
"value": 25600
}
]
},
Our worklow is relatively light for the moment:
Kafka -> python consumer-> Kudu
And the python consumer read about 25 messages per second with an average of 150 kb per second, and insert the data into kudu via impyla. (There are no updates and no deletes)
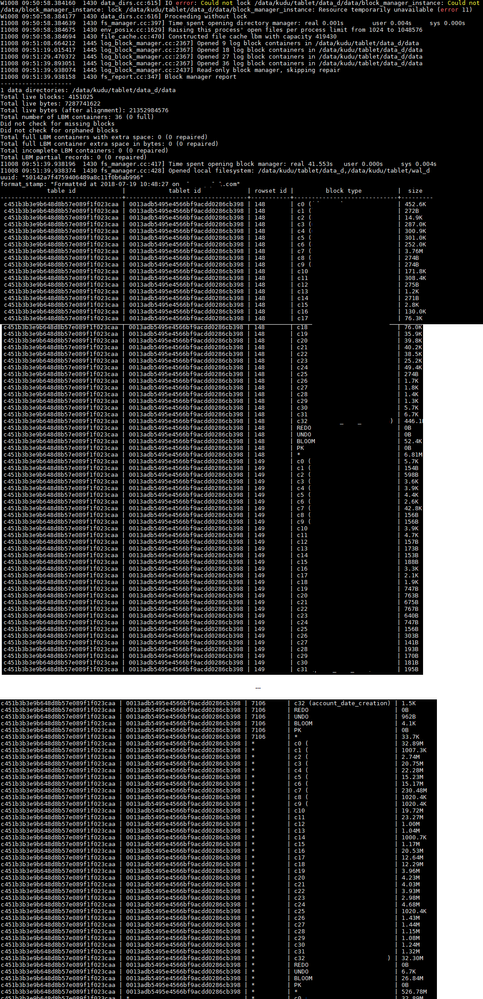
Below is the output for the following commands on the tablet server (the 3 tablet servers have the same memory problem):
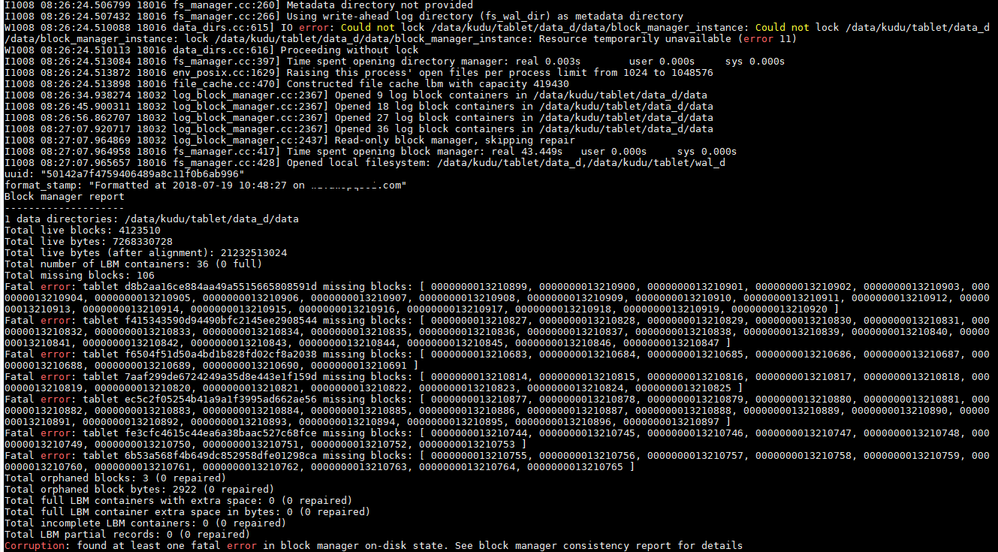
sudo -u kudu kudu fs check --fs_wal_dir=<wal dir> --fs_data_dirs=<data dirs>
We didn't expect to have so many missing blocks ...
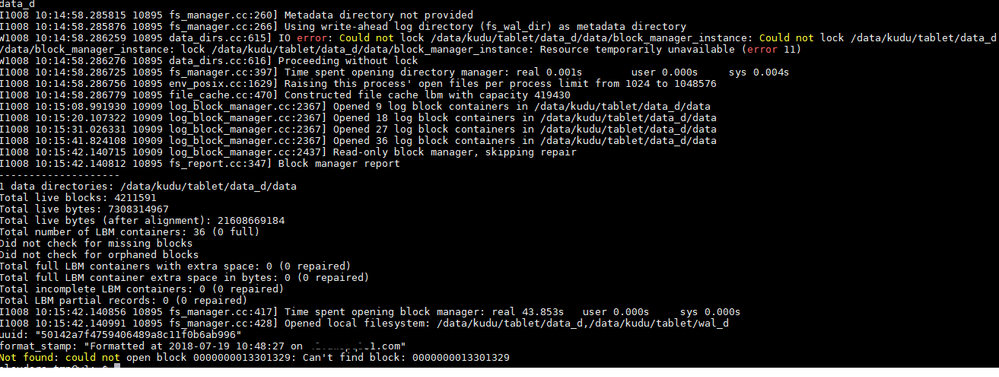
For a tablet with the command:
sudo -u kudu kudu local_replica data_size 6a1b491538e24709808172aabd4cedae --fs_wal_dir=<wal dir> --fs_data_dirs=<data dirs>:
And very often we couldn't use the command because of missing block:
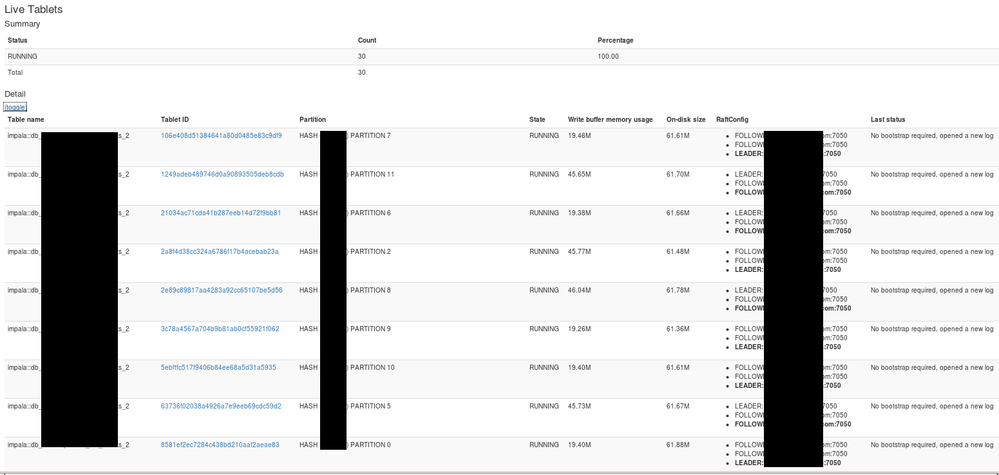
Finally we have also notice the "Write buffer memory usage" on tablets. It seems a bit high for our workload isn't it ?
Thank you in advance,
Vincent
Created 10-18-2018 11:05 AM
- Mark as New
- Bookmark
- Subscribe
- Mute
- Subscribe to RSS Feed
- Permalink
- Report Inappropriate Content
Created 10-22-2018 02:42 AM
- Mark as New
- Bookmark
- Subscribe
- Mute
- Subscribe to RSS Feed
- Permalink
- Report Inappropriate Content
Hi,
No problem for the delay.
Yes to resume, we have between 10 and 1000 messages per seconds to ingest indu Kudu, and each message is about 200+ bytes.
And using Impyla we do individual row insertion (or insertion for 5 or 10 messages), does that explain all the small data blocks?
Using CTAS it's much better thanks.
But in general, do you have any recommandation for fast individual row insertion without too increasing memory usage? And in case of a slow streaming write ? The thing is that we would like to query the table fast enough with the latest data.
Many thanks,
Vincent
