Our Community is getting an upgrade! To get everything ready for the relaunch, we’ll be placing the site in read-only mode starting September 21st.
We really appreciate your understanding while we get things set up behind the scenes. Catch up on all the exciting details about the move here.
Need help or have questions? Drop us a line at [email protected]

Support Questions

Find answers, ask questions, and share your expertise
Announcements
Share your experience with Cloudera on G2 and get a $25 Amazon Gift card.
Hi, I'm CLEO! Something exciting is coming to the Community. Stay Tuned!

NiFi wait processor huge number of events IN compared to OUT.

avatar
New Contributor

I need help with config of  wait module.

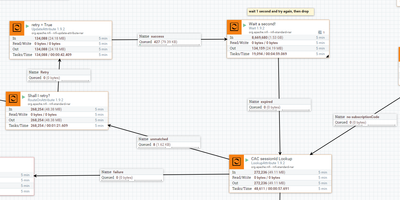
I am trying to execute lookup and if not matched , retry loop is entered with wait 1sec. second loop the message is dropped. 

THe mechanism works, but I worry of numbers provided by wait module. 
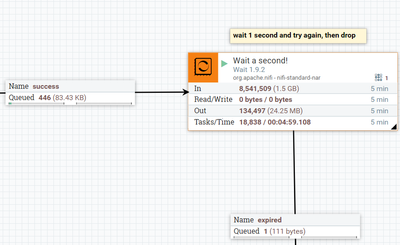
it shows 8mil files IN, and 134k files out. 

Petr_Simik_0-1585226313263.png

Petr_Simik_1-1585226348611.pngPetr_Simik_2-1585226368120.png

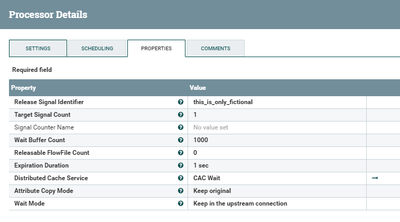
Is this a correct setup ?

Why and where is the 8mil IN comming from? 
How to avoid this?
I worry it will crash when more traffic comes in. 
Thank you


1 ACCEPTED SOLUTION

avatar
Master Mentor

@Petr_Simik 


No matter which processor you are looking at the stats presented all tell you the same information:

In  <-- Tells you how many FlowFile were processed from one or more inbound connections over the last rolling 5 minute window.  With this processor you have it configured the "wait mode" to leave the FlowFile on the inbound connection.  So the processor is constantly looking at the file over and over again until the configured expiration time has elapsed.

Read/Write. <-- Tells you how much FlowFile content was read from or written to the NiFi content repository (helps user identify processors that may be disk I/O heavy)


Out. <-- Tells you how many FlowFiles have been released to an outbound connection over the last rolling 5 minute window.  Here you see a number that reflects only those flowfiles that expired and where sent to your outbound expired connection.

Tasks/Time. <-- Tells you how many threads this processor completed execution over the last rolling 5 minutes and the total cumulative time those threads consumed from the CPU.   (helps user identify what processors consume lots of CPU time)

So the stats you are seeing are not surprising.

While this processor works for your use case i guess, it has overhead needing to connect to a distributed map cache on every execution against an inbound FlowFile.  If your intent is only to delay a FlowFile for 1 second before it proceeds down the flow path, a better solution may be to just use an updateAttribute processor that creates an attribute with current time and RouteOnAttribute processor that checks to see if that recorded time plus 1000 ms is less than current time.  Then loop that check until it is not.

Hope this helps,

Matt

View solution in original post

1 REPLY 1

avatar
Master Mentor

@Petr_Simik 


No matter which processor you are looking at the stats presented all tell you the same information:

In  <-- Tells you how many FlowFile were processed from one or more inbound connections over the last rolling 5 minute window.  With this processor you have it configured the "wait mode" to leave the FlowFile on the inbound connection.  So the processor is constantly looking at the file over and over again until the configured expiration time has elapsed.

Read/Write. <-- Tells you how much FlowFile content was read from or written to the NiFi content repository (helps user identify processors that may be disk I/O heavy)


Out. <-- Tells you how many FlowFiles have been released to an outbound connection over the last rolling 5 minute window.  Here you see a number that reflects only those flowfiles that expired and where sent to your outbound expired connection.

Tasks/Time. <-- Tells you how many threads this processor completed execution over the last rolling 5 minutes and the total cumulative time those threads consumed from the CPU.   (helps user identify what processors consume lots of CPU time)

So the stats you are seeing are not surprising.

While this processor works for your use case i guess, it has overhead needing to connect to a distributed map cache on every execution against an inbound FlowFile.  If your intent is only to delay a FlowFile for 1 second before it proceeds down the flow path, a better solution may be to just use an updateAttribute processor that creates an attribute with current time and RouteOnAttribute processor that checks to see if that recorded time plus 1000 ms is less than current time.  Then loop that check until it is not.

Hope this helps,

Matt