Support Questions
- Cloudera Community
- Support
- Support Questions
- Re: Nifi Sample Workflow to test Nifi Cluster Setu...
- Subscribe to RSS Feed
- Mark Question as New
- Mark Question as Read
- Float this Question for Current User
- Bookmark
- Subscribe
- Mute
- Printer Friendly Page
- Subscribe to RSS Feed
- Mark Question as New
- Mark Question as Read
- Float this Question for Current User
- Bookmark
- Subscribe
- Mute
- Printer Friendly Page
Nifi Sample Workflow to test Nifi Cluster Setup
- Labels:
-
Apache NiFi
Created 03-28-2017 01:15 PM
- Mark as New
- Bookmark
- Subscribe
- Mute
- Subscribe to RSS Feed
- Permalink
- Report Inappropriate Content
Hi Team,
Can someone share the Nifi Sample Workflow template to test Nifi cluster setup. I have configured 3 node nifi cluster. i want to test the nifi cluster functions.
Kindly share.
Created 03-28-2017 02:22 PM
- Mark as New
- Bookmark
- Subscribe
- Mute
- Subscribe to RSS Feed
- Permalink
- Report Inappropriate Content
Each Node in a NiFi cluster runs its own copy of the dataflow. Nodes do not automatically share data between them.
I agree that the simple flow described by mliem above is great to test dataflow performance per node, it does not test comms between nodes.
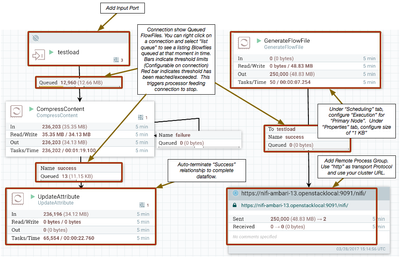
1. Try setting up a dataflow that uses S2S as well to distribute data between your nodes.
GenerateFlowFile ---> RPG
inputport ---> CompressContent --> updateAttribute.
The above will show how network between nodes behaves.
While the dataflow is running, try removing and/or adding an additional node to your NiFi cluster.
2. If you are running securely, make sure your user can successfully login to the UI of every node in your cluster and successfully make a change on the canvas.
3. Manually disconnect the node that is marked as the cluster coordinator and/or primary node. Verify that a new Cluster coordinator and/or primary node is elected.
4. Configure a processor to run on "primary node only". Verify that the node assigned "Primary" node is the only node running that processor. Shutdown current node elected as primary node and make sure whichever node is elected as new primary node starts running that processor.
Thanks,
Matt
Created 03-28-2017 01:27 PM
- Mark as New
- Bookmark
- Subscribe
- Mute
- Subscribe to RSS Feed
- Permalink
- Report Inappropriate Content
I usually test nifi cluster functions by setting up a very simple flow such as:
GenerateFlowFile -> CompressContent -> UpdateAttribute
Created on 03-28-2017 02:08 PM - edited 08-18-2019 02:48 AM
- Mark as New
- Bookmark
- Subscribe
- Mute
- Subscribe to RSS Feed
- Permalink
- Report Inappropriate Content
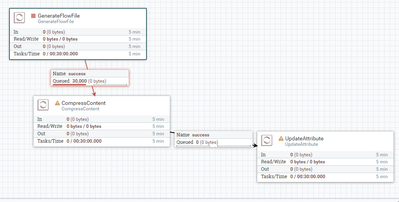
Thanks for the reply i am very new to nifi i have just created the processor and give connections
Can you just explain how it will work means.
1) where it will store generated flow file and once success
2) how it will compress
3) at what point the update attribute processor will work.
Kindly guide to understand nifi processor.
Created 03-28-2017 02:18 PM
- Mark as New
- Bookmark
- Subscribe
- Mute
- Subscribe to RSS Feed
- Permalink
- Report Inappropriate Content
1) locally..I would also change generate flow file processor to have a file size of say 1KB to start and scale up from there. It looks like you've left it as the default of 0. (30,000 flow files but 0 bytes)
2) You need to make sure all route paths are taken care of. If you put your cursor over the yellow exclamation mark it'll highlight error. In your case you need to handle the failure route. (send to funnel or another processor)
3) Once compresscontent is completed
Created 03-28-2017 02:22 PM
- Mark as New
- Bookmark
- Subscribe
- Mute
- Subscribe to RSS Feed
- Permalink
- Report Inappropriate Content
Each Node in a NiFi cluster runs its own copy of the dataflow. Nodes do not automatically share data between them.
I agree that the simple flow described by mliem above is great to test dataflow performance per node, it does not test comms between nodes.
1. Try setting up a dataflow that uses S2S as well to distribute data between your nodes.
GenerateFlowFile ---> RPG
inputport ---> CompressContent --> updateAttribute.
The above will show how network between nodes behaves.
While the dataflow is running, try removing and/or adding an additional node to your NiFi cluster.
2. If you are running securely, make sure your user can successfully login to the UI of every node in your cluster and successfully make a change on the canvas.
3. Manually disconnect the node that is marked as the cluster coordinator and/or primary node. Verify that a new Cluster coordinator and/or primary node is elected.
4. Configure a processor to run on "primary node only". Verify that the node assigned "Primary" node is the only node running that processor. Shutdown current node elected as primary node and make sure whichever node is elected as new primary node starts running that processor.
Thanks,
Matt
Created on 03-28-2017 03:24 PM - edited 08-18-2019 02:48 AM
- Mark as New
- Bookmark
- Subscribe
- Mute
- Subscribe to RSS Feed
- Permalink
- Report Inappropriate Content
Created on 03-28-2017 04:00 PM - edited 08-18-2019 02:48 AM
- Mark as New
- Bookmark
- Subscribe
- Mute
- Subscribe to RSS Feed
- Permalink
- Report Inappropriate Content
Still i am in the beginning stage in Nifi, i have more questions most of the times it is stupid please bare.
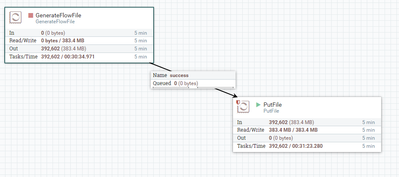
I have created a below processor and it working
My question is it showing processed 383.4MB but when i checked in all 3 nodes it showing different sizes and the file count also not matched..
Connected Node:
[1548691@HKLPATHAS03 flow]$ ls -ltrh | wc -l
138190
[1548691@HKLPATHAS03 flow]$ du -sh
545M    .
Connected Node:
[1548691@HKLPATHAS01 anish]$ du -sh
503M    .
[1548691@HKLPATHAS01 anish]$ cd flow/
[1548691@HKLPATHAS01 flow]$ ls -ltrh | wc -l
127358
CONNECTED, PRIMARY, COORDINATOR Node:
[1548691@HKLPATHAS02 anish]$ du -sh flow
502M    flow
[1548691@HKLPATHAS02 anish]$ cd flow/
[1548691@HKLPATHAS02 flow]$ ls -ltrh | wc -l
127057
Then in what way it acts as cluster?
Created 03-28-2017 04:23 PM
- Mark as New
- Bookmark
- Subscribe
- Mute
- Subscribe to RSS Feed
- Permalink
- Report Inappropriate Content
No problem, everyone starts somewhere.
Keep in mind that in a cluster every node is running the same dataflow. Node 1 has no idea what node 2 is doing and vice versa.
So by default all 3 nodes in your cluster running the above dataflow and each may perform slightly different. When looking at the Ui of any one of the nodes in your NiFi cluster, the stats shown are the cumulative stats for all node sin your cluster. You should not assume that the numbers will always evenly divide between your connected nodes.
When you make a request in the UI, that request must be replicated to all nodes in your cluster. So image a request to start or stop your GenerateFlowFile processor, that Processor may get started or stopped at not the exact same moment in time on each node. Considering the rate at which it produces your small test files, i would not expect the numbers to be the same. In addition, other very small difference can affect each node differently. What other process, service, OS level thing happen to run on one node and not another. which node is the cluster coordinator (does extra work), etc... While in the big picture the impact to over performance is negligible, with this simple flow you can see some differences.
You can right click on a processor and select "Status History" to open a graph that will show various stats per node. The different stats are in a pull-down menu in the upper right corner of the Status History window. Blue line shows cumulative values (same as what is shown on processors). There is a different colored line for each node.
Some suggestion for using this forum:
1. Try to keep one question per post, you tend to get better responses that way. This questions is related, so you are good there.
2. If you find an answer that got you the answer you were looking for, accept that answer so it benefits others using this forum.
Thank you, Matt
Created 03-28-2017 05:29 PM
- Mark as New
- Bookmark
- Subscribe
- Mute
- Subscribe to RSS Feed
- Permalink
- Report Inappropriate Content
Thanks matt for your guidance.


