Support Questions
- Cloudera Community
- Support
- Support Questions
- Premature EOF: Error while reading and writing dat...
- Subscribe to RSS Feed
- Mark Question as New
- Mark Question as Read
- Float this Question for Current User
- Bookmark
- Subscribe
- Mute
- Printer Friendly Page
- Subscribe to RSS Feed
- Mark Question as New
- Mark Question as Read
- Float this Question for Current User
- Bookmark
- Subscribe
- Mute
- Printer Friendly Page
Premature EOF: Error while reading and writing data in HDFS
Created 08-29-2019 04:20 AM
- Mark as New
- Bookmark
- Subscribe
- Mute
- Subscribe to RSS Feed
- Permalink
- Report Inappropriate Content
Ambari 2.6 and HDP 2.6.3.
The error is displayed while performing the following error:
1) HDFS get operation.
2) While aggregating and writing file on HDFS using pyspark.
Error: "19/08/29 15:53:02 WARN hdfs.DFSClient: Failed to connect to /DN_IP:1019 for block, add to deadNodes and continue. java.io.EOFException: Premature EOF: no length prefix available "
We found the following links to resolve the above error.
=> To set dfs.datanode.max.transfer.threads=8196
1) https://www.netiq.com/documentation/sentinel-82/admin/data/b1nbq4if.html (Performance Tuning Guidelines)
2) https://github.com/hortonworks/structor/issues/7 (jmaron commented on Jul 28, 2014)
Could you all please suggest shall i go ahead with this resolution?
Does this configuration affects any other services?
Thankyou
Created 09-05-2019 04:46 AM
- Mark as New
- Bookmark
- Subscribe
- Mute
- Subscribe to RSS Feed
- Permalink
- Report Inappropriate Content
Hi All,
Resolved using below steps:
1) To observe the Datanode threads:
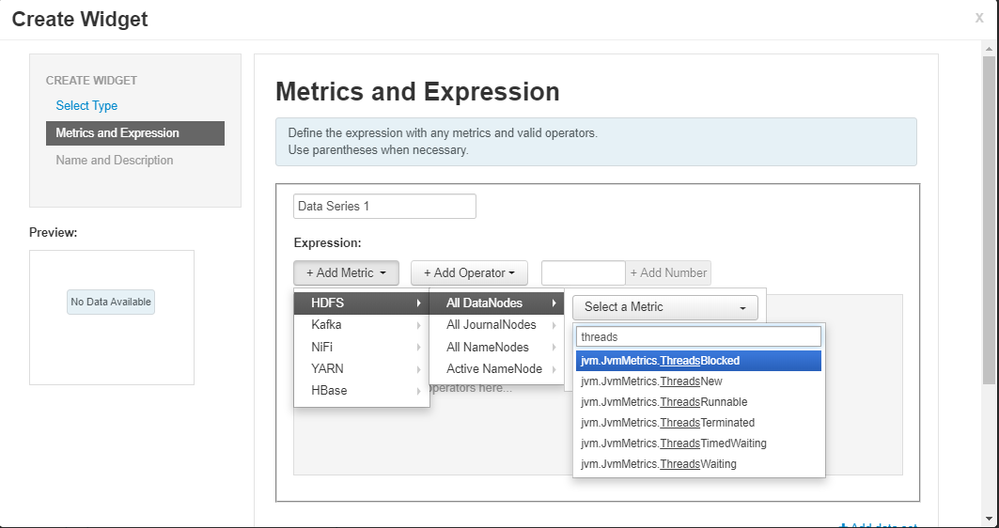
- Created a widget in Ambari under HDFS for DataNode Threads (Runnable, Waited, Blocked)
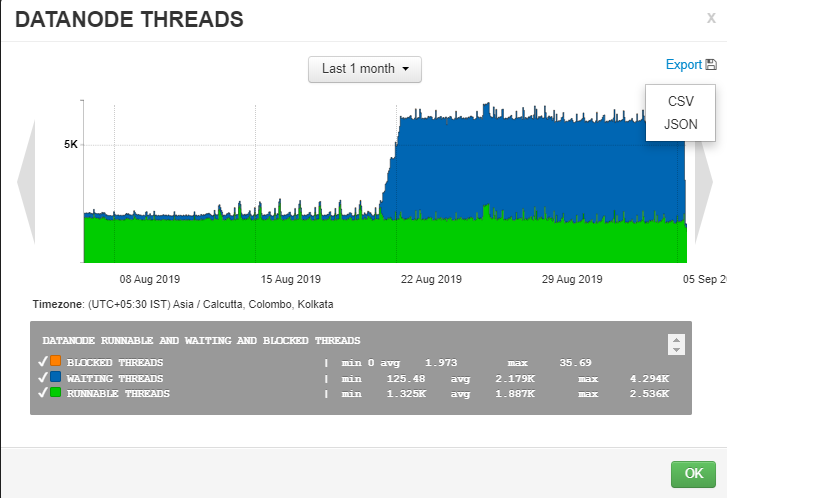
- Monitored that from a particular date the threads went in wait stage.
- Exported the graph widget CSV file to view the exact time of wait threads.
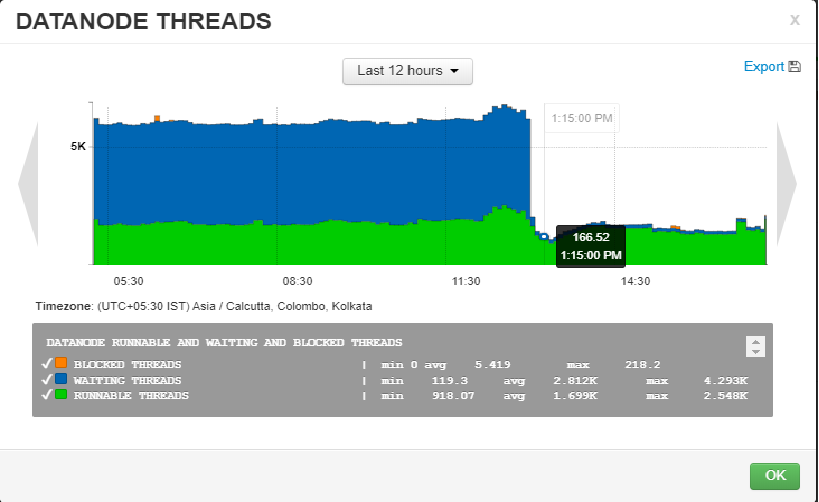
2) Restart all Datanodes manually and observed that the wait threads were released.
3) With default 4096 threads the DataNode is running properly.
Still unable to understand:
1) How to check the wait threads are in which DataNode?
2) Which task or process tend to threads in the wait stage?
Would like to know if anyone comes across this and able to find in detail.
Else the above steps are the only solution for wait threads.


