Support Questions
- Cloudera Community
- Support
- Support Questions
- Re: Problem with Merge Content Processor after swi...
- Subscribe to RSS Feed
- Mark Question as New
- Mark Question as Read
- Float this Question for Current User
- Bookmark
- Subscribe
- Mute
- Printer Friendly Page
- Subscribe to RSS Feed
- Mark Question as New
- Mark Question as Read
- Float this Question for Current User
- Bookmark
- Subscribe
- Mute
- Printer Friendly Page
Problem with Merge Content Processor after switch to v 1.16.2
- Labels:
-
Apache NiFi
Created 06-20-2022 01:39 AM
- Mark as New
- Bookmark
- Subscribe
- Mute
- Subscribe to RSS Feed
- Permalink
- Report Inappropriate Content
Hello, I'm using nifi in version 1.13.1 and there got no problems but with upgrade to 1.16.2 got following issue with Merge Content Processor:
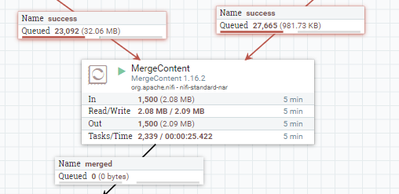
Flow files are merged by flow file name. When 1500 messages come in then its just stopping with merging. When I stop the processor manually and start it again he will again pull 1500 messages and stop again. Implementation is old, works fine on 1.13.1 but with 1.16.2 something has change and I don't know where to find root cause. Any idea what I should check ?
Created 06-21-2022 08:23 AM
- Mark as New
- Bookmark
- Subscribe
- Mute
- Subscribe to RSS Feed
- Permalink
- Report Inappropriate Content
@Drozu
- How does disk usage for your NiFi repositories look?
- Any ERRORS or WARN logging related writing content?
- What do you have set for your "Max Timer Driven Thread cCount" in controller settings (how many cores does the host where you NiFi is running have?)?
- Is this a standalone NiFi or a NiFi multi-node cluster (what is the distribution of the FlowFiles on the inbound connections?)?
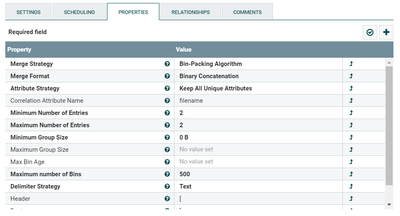
- How has the MergeContent processor been configured?
Thanks,
Matt
Created 06-21-2022 12:37 PM
- Mark as New
- Bookmark
- Subscribe
- Mute
- Subscribe to RSS Feed
- Permalink
- Report Inappropriate Content
@MattWho Thank you for your reply,
-There is a lot of disk space left, more than 50GB
- The only Error I can observe is: (but not always)
- Max Timer Driven Thread Count : 50
-This is cluster - 3 nodes - every node has 8 cores, JVM Heap 2GB used 50%,
-Merge Content:
Whole configuration is the same on Nifi 1.13.1 and there all works fine.
Created 06-21-2022 01:39 PM
- Mark as New
- Bookmark
- Subscribe
- Mute
- Subscribe to RSS Feed
- Permalink
- Report Inappropriate Content
@Drozu
That was the exact exception I want you to find.
NiFi writes the content for each of your FlowFiles to the content repository in to content claims. These content claims can contain the content for 1 too many FlowFiles. Once a content claims has zero FlowFiles referencing that claim anymore it gets moved to an "archive" sub-directory.
A NiFi background thread then deletes those claims based on archive retention settings in the nifi.properties file.
https://nifi.apache.org/docs/nifi-docs/html/administration-guide.html#content-repository
To help prevent NiFi from filling the disk to 100% because of old archived claims, NiFi will stop all processors from being able to write to the content repository. So when you see this log message, NiFi is applying backpressure and blocking processors that write new content (like MergeContent) until archive cleanup free space or no archived claims exist anymore.
As far as stopping and starting the processor goes, it think that action simply gave enough time for archive cleanup to get below the threshold. Then new content written by this processor along with other pushing threshold above the backpressure limit again.
The below property controls this upper limit:
nifi.content.repository.archive.backpressure.percentageIf not set it defaults to 2% higher then what is set in this property:
nifi.content.repository.archive.max.usage.percentageThe above property defaults to "50%", which you stated is your current disk usage.
So i think you are sitting right at that threshold and keep blocking and unblocking.
Things you should do:
1. Make sure you do not leave FlowFiles lingering in your dataflow queues. Since a content claim contains the content for 1 too many FlowFiles, all it takes is one small queued FlowFiles to hold up the archival and removal of a much larger claim. <-- most important thing to do here.
2. Change the setting for "nifi.content.repository.archive.backpressure.percentage" to something other than default (for example: 75%). But keep in mind that if your are not properly handling your FlowFiles in your dataflow and allowing them to accumulate in dead end flows or connections to stopped processors, you are just pushing your issue down the road. You will hit 75% and potentially have sam issue.
If you don't care about archiving of content, turn is off:
nifi.content.repository.archive.enabled=false
There were also some bugs in 1.13 related to proper archive claimant count that were addressed in later releases.
https://issues.apache.org/jira/browse/NIFI-9993
https://issues.apache.org/jira/browse/NIFI-10023
So I also recommend upgrading as well to 1.16.2 or newer.
If you found this response assisted with your query, please take a moment to login and click on "Accept as Solution" below this post.
Thank you,
Matt
Created 06-22-2022 01:48 AM
- Mark as New
- Bookmark
- Subscribe
- Mute
- Subscribe to RSS Feed
- Permalink
- Report Inappropriate Content
@MattWho Thanks for this informations, I have tried to turn off this archive with setting parameter:
nifi.content.repository.archive.enabled=false
I'm no longer observing this message:
but it did not resolve the issue I have. Merge Content processor still stops and I need to stop it and start manually to push whole process forward. Any other idea what I could do ?
Created 06-29-2022 12:49 PM
- Mark as New
- Bookmark
- Subscribe
- Mute
- Subscribe to RSS Feed
- Permalink
- Report Inappropriate Content
@Drozu
Switching off the content repository archiving would not result in an automatic clean-up of your archived content claim. Make sure that all the "archive" sub-directories in the numbered directories within the content-repository are empty.
After disabling archive, any change in disk utilization on your 3 nodes? Did content repository disk fill to 100%?
There are many things that go into evaluating performance of your NiFi and its dataflows. Anytime you add new components via the NiFi canvas, the dynamics can change.
How many components are running? (if all 50 timer driven threads are currently in use by other components, other components will just be waiting for an available thread)
How often is JVM garbage collection (GC) happening?
How many timer driven threads are in use at time processors seems to stop?
How are the queued FlowFiles to the MergeContent distributed across your 3 nodes?
How many concurrent tasks on MergeContent?
What do the Cluster UI stats show for per node thread count, GC stats, cpu load average, etc.?
Any other WARN or ERROR log output going on in the nifi-app.log. (Maybe related to OOM or Open File limits for example)?
Looks like you are using your mergeContent processor to merge two FlowFiles together that have the same filename attribute value. Does one inbound connection contain 1 FlowFile and the other contain the other FlowFile in the pair? The MergeContent is not going to parse through the queued FlowFiles looking for a match. How are you handling "Failure" with the MergeContent? It round robins each connection, so in execution A, it reads from connection 1 and bins those FlowFiles. Then on next execution, it reads from connection B. Try adding a funnel before your MergeContent and redirecting your two source success connection in to that funnel and dragging a single connection from the funnel to the MergeContent.
Thank you,
Matt
Created 06-29-2022 06:14 PM
- Mark as New
- Bookmark
- Subscribe
- Mute
- Subscribe to RSS Feed
- Permalink
- Report Inappropriate Content
@MattWho ,
No sure this is what's happening here, but if the disk is filled with other stuff that's outside of NiFi's control and the overall disk usage is still hitting the configured NiFi limits, the same thing would happen, right?
André
Was your question answered? Please take some time to click on "Accept as Solution" below this post.
If you find a reply useful, say thanks by clicking on the thumbs up button.
Created 06-30-2022 06:04 AM
- Mark as New
- Bookmark
- Subscribe
- Mute
- Subscribe to RSS Feed
- Permalink
- Report Inappropriate Content
@araujo
Once "nifi.content.repository.archive.enabled=false" is set to false, content claims that no longer have any FlowFiles referencing them will no longer get moved to "Archive" sub-directories. They instead simply get removed. The logic built around the backpressure checks to see if there is archived content claims still and if none, allows content to continue to be written until disk is full. If the archive claimant count is not zero, backpressure kicks in until that count goes to zero through archive removal. This backpressure mechanism is in place so that the archive clean-up process can catch-up. The fact that NiFi will allow content repo writes until disk full is why it is important that users do not co-locate any of the other NiFi repositories on the same disk as the content repository.
If disk filling became an issue, the processors that write new content would not just stop executing. They would start throwing exceptions in the logs about insufficient disk space.
@Drozu The original image shared of your canvas shows a MergeContent processor in a "running" state , but does not indicate an active thread at time of image capture. An active thread shows as a small number in the upper right corner of the processor. The processor image all shows that this MergeContent processor also executed 2,339 threads in just the last 5 minutes. Execution does not mean an output FlowFile will always be produced. If none of the bins are eligible for merge, then nothing is going to be output.
When the processor is in a state of "not working" do all that processor stats go to 0 including the "Tasks/Time"? Does it also at that same time indicate a number in its upper right corner? This would indicate that the processor has an active thread that has been in execution for over 5 minutes. In a scenario like this, it is best to get a series of ~4 NiFi thread dumps to see why this thread is running so long and what it is waiting on.
If the stats go to zeros and you do not see an active thread number on the processor, this indicates the processor is not getting a thread in last 5 minutes from the Timer Driven thread pool. Then you need to look at thread pool usage per node. Is the complete thread pool in use by other components?
Thanks,
Matt
Created 07-13-2022 07:57 AM
- Mark as New
- Bookmark
- Subscribe
- Mute
- Subscribe to RSS Feed
- Permalink
- Report Inappropriate Content
@Drozu, Have any of the replies helped resolve your issue? If so, please mark the appropriate reply as the solution, as it will make it easier for others to find the answer in the future.
Regards,
Vidya Sargur,Community Manager
Was your question answered? Make sure to mark the answer as the accepted solution.
If you find a reply useful, say thanks by clicking on the thumbs up button.
Learn more about the Cloudera Community:


