Support Questions
- Cloudera Community
- Support
- Support Questions
- Re: Why do alerts show up when i submit a job?
- Subscribe to RSS Feed
- Mark Question as New
- Mark Question as Read
- Float this Question for Current User
- Bookmark
- Subscribe
- Mute
- Printer Friendly Page
- Subscribe to RSS Feed
- Mark Question as New
- Mark Question as Read
- Float this Question for Current User
- Bookmark
- Subscribe
- Mute
- Printer Friendly Page
Why do alerts show up when i submit a job?
- Labels:
-
Apache Ambari
-
Apache Hadoop
-
Apache Hive
Created on 08-22-2017 07:38 AM - edited 08-17-2019 06:33 PM
- Mark as New
- Bookmark
- Subscribe
- Mute
- Subscribe to RSS Feed
- Permalink
- Report Inappropriate Content
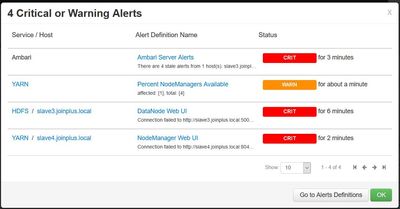
Hi, my cluster seems to work fine, but when I submit a hive or sqoop job I get alerts (see screnshot).
I already followed the recommendations of the post "how to get rid of ambari stale alerts", but they keep showing up...
My cluster is running on vsphere virtual machines. Could this cause the problem. e.g. network is overloaded?
Created 08-22-2017 07:48 AM
- Mark as New
- Bookmark
- Subscribe
- Mute
- Subscribe to RSS Feed
- Permalink
- Report Inappropriate Content
The "Ambari Server Alerts" normally occurs if the Ambari Agents are not reporting alert status, Agents are not running (Or due to some Load on the Host/Agent machine the Agent is not able to respond to Ambari Server) then we can see this kind of alert.
.
We can check the heartbeat messages of the agents in the "/var/log/ambari-agent/ambari-agent.log" file. If some heartbeats were lost when this issues happened. If that is happening as soon as we trigger a job then it indicates that the Job might be utilizing lots of N/W bandwidth OR Sockets OR system resources etc.
.
The rest two alerts are WebUI alerts from the NodeManager and DataNode , it might be due to Long GC pause or resource limitations on those hosts that When the job was running these processes could not respond to ambari agents request to access the Web UI which may be due to slow /W call as well.
Increasing the UI alert "Connection timeout" from 5 to 15 or more seconds and "Check Interval" to 2-3 minutes can help in reducing the CRITICAL messages.
.
In General this can happen broadly due to Resource Limitations (Either N/W bandwidth / Load OR the Host over loaded with memory/cpu).
Created 08-22-2017 07:39 AM
- Mark as New
- Bookmark
- Subscribe
- Mute
- Subscribe to RSS Feed
- Permalink
- Report Inappropriate Content
A few minutes after the job has ended everything is back to normal
Created 08-22-2017 07:48 AM
- Mark as New
- Bookmark
- Subscribe
- Mute
- Subscribe to RSS Feed
- Permalink
- Report Inappropriate Content
The "Ambari Server Alerts" normally occurs if the Ambari Agents are not reporting alert status, Agents are not running (Or due to some Load on the Host/Agent machine the Agent is not able to respond to Ambari Server) then we can see this kind of alert.
.
We can check the heartbeat messages of the agents in the "/var/log/ambari-agent/ambari-agent.log" file. If some heartbeats were lost when this issues happened. If that is happening as soon as we trigger a job then it indicates that the Job might be utilizing lots of N/W bandwidth OR Sockets OR system resources etc.
.
The rest two alerts are WebUI alerts from the NodeManager and DataNode , it might be due to Long GC pause or resource limitations on those hosts that When the job was running these processes could not respond to ambari agents request to access the Web UI which may be due to slow /W call as well.
Increasing the UI alert "Connection timeout" from 5 to 15 or more seconds and "Check Interval" to 2-3 minutes can help in reducing the CRITICAL messages.
.
In General this can happen broadly due to Resource Limitations (Either N/W bandwidth / Load OR the Host over loaded with memory/cpu).
Created 08-22-2017 08:05 AM
- Mark as New
- Bookmark
- Subscribe
- Mute
- Subscribe to RSS Feed
- Permalink
- Report Inappropriate Content
so basically the root of the problem is the lack of resources? and if i cannot increase them, i can just deal with the symptoms (alerts)?
Created 08-22-2017 08:27 AM
- Mark as New
- Bookmark
- Subscribe
- Mute
- Subscribe to RSS Feed
- Permalink
- Report Inappropriate Content
There can be two approaches
1. To Suppress the alerts (if they are getting cleared quickly), Means increasing the "timeout" and "check interval" of those alerts.
2. Finding the resources that might be causing the issue like looking at the Memory
# free -m
# top
# Logs of individual components like DataNode & NodeManager (When they were not responding) were there any Long GC pause?    Looking at the GC log of DataNode/NodeManager can be helpful to know if there were Long GC pauses?
# /var/log/messages   to see any abnormal behaviour during the time period.
# SAR Report (Historical Data Capturing of the OS which includes various statistocs including  IO/CPU/Memory ...etc).

.


