Support Questions
- Cloudera Community
- Support
- Support Questions
- YARN Capacity Scheduler Queue utilisation graph.
- Subscribe to RSS Feed
- Mark Question as New
- Mark Question as Read
- Float this Question for Current User
- Bookmark
- Subscribe
- Mute
- Printer Friendly Page
- Subscribe to RSS Feed
- Mark Question as New
- Mark Question as Read
- Float this Question for Current User
- Bookmark
- Subscribe
- Mute
- Printer Friendly Page
YARN Capacity Scheduler Queue utilisation graph.
- Labels:
-
Apache YARN
Created 12-09-2015 02:38 PM
- Mark as New
- Bookmark
- Subscribe
- Mute
- Subscribe to RSS Feed
- Permalink
- Report Inappropriate Content
Is there any tool which will give Queue utilisation(memory, cores) graph?
I want historical data in graphical representation, so that I can adjust my workload(reschedule jobs) as per resource utilization trend over time.
Created on 12-16-2015 04:42 AM - edited 08-19-2019 05:43 AM
- Mark as New
- Bookmark
- Subscribe
- Mute
- Subscribe to RSS Feed
- Permalink
- Report Inappropriate Content
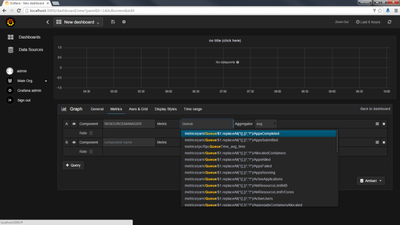
I guess Grafana with Ambari can help on this. Please use link to setup and configure Grafana.
Once Grafana is accessible, design your dashboard. Below are few sample screenshots:
Created 12-09-2015 02:40 PM
- Mark as New
- Bookmark
- Subscribe
- Mute
- Subscribe to RSS Feed
- Permalink
- Report Inappropriate Content
@Rahul Pathak That will be RM UI, You can see all the jobs running and using different queues.
Click Yarn in ambari --> Quick links
Created 12-09-2015 02:44 PM
- Mark as New
- Bookmark
- Subscribe
- Mute
- Subscribe to RSS Feed
- Permalink
- Report Inappropriate Content
I want historical data in graphical representation, so that I can adjust my workload(reschedule jobs) as per resource utilization trend over time.
Created 12-09-2015 03:20 PM
- Mark as New
- Bookmark
- Subscribe
- Mute
- Subscribe to RSS Feed
- Permalink
- Report Inappropriate Content
@Rahul Pathak You are looking for something like this
Created 12-09-2015 03:34 PM
- Mark as New
- Bookmark
- Subscribe
- Mute
- Subscribe to RSS Feed
- Permalink
- Report Inappropriate Content
@Neeraj Sabharwal I need something like this. But working on real data.
Created on 12-16-2015 04:42 AM - edited 08-19-2019 05:43 AM
- Mark as New
- Bookmark
- Subscribe
- Mute
- Subscribe to RSS Feed
- Permalink
- Report Inappropriate Content
I guess Grafana with Ambari can help on this. Please use link to setup and configure Grafana.
Once Grafana is accessible, design your dashboard. Below are few sample screenshots:
Created 12-16-2015 05:50 AM
- Mark as New
- Bookmark
- Subscribe
- Mute
- Subscribe to RSS Feed
- Permalink
- Report Inappropriate Content
Thanks.
I will check and let you know.
Created 12-16-2015 08:04 AM
- Mark as New
- Bookmark
- Subscribe
- Mute
- Subscribe to RSS Feed
- Permalink
- Report Inappropriate Content
It is working fine. Thanks once again.
However I guess this is not available for ambari without ambari metrics collector.
Is there way to achieve this for Ambari Version1.5.1.110
Created 12-16-2015 04:19 PM
- Mark as New
- Bookmark
- Subscribe
- Mute
- Subscribe to RSS Feed
- Permalink
- Report Inappropriate Content
For Ambari 1.5, Am not sure which fits this requirement. Will let you know, If I find anything.
Created 02-10-2016 12:51 PM
- Mark as New
- Bookmark
- Subscribe
- Mute
- Subscribe to RSS Feed
- Permalink
- Report Inappropriate Content
@Rahul Pathak @Neeraj Sabharwal : I am trying to configure grafan with ambari and trying to create graph but it is throwing me an error. So can you please point me to solution.
Problem! The requested resource doesn't exist: ServiceComponentHost not found, clusterName=HDPTST, serviceName=AMBARI_METRICS, serviceComponentName=METRICS_COLLECTOR, hostName=test.com


