Support Questions
- Cloudera Community
- Support
- Support Questions
- Re: YARN Capacity Scheduler Queue utilisation grap...
- Subscribe to RSS Feed
- Mark Question as New
- Mark Question as Read
- Float this Question for Current User
- Bookmark
- Subscribe
- Mute
- Printer Friendly Page
- Subscribe to RSS Feed
- Mark Question as New
- Mark Question as Read
- Float this Question for Current User
- Bookmark
- Subscribe
- Mute
- Printer Friendly Page
YARN Capacity Scheduler Queue utilisation graph.
- Labels:
-
Apache YARN
Created 12-09-2015 02:38 PM
- Mark as New
- Bookmark
- Subscribe
- Mute
- Subscribe to RSS Feed
- Permalink
- Report Inappropriate Content
Is there any tool which will give Queue utilisation(memory, cores) graph?
I want historical data in graphical representation, so that I can adjust my workload(reschedule jobs) as per resource utilization trend over time.
Created on 12-16-2015 04:42 AM - edited 08-19-2019 05:43 AM
- Mark as New
- Bookmark
- Subscribe
- Mute
- Subscribe to RSS Feed
- Permalink
- Report Inappropriate Content
I guess Grafana with Ambari can help on this. Please use link to setup and configure Grafana.
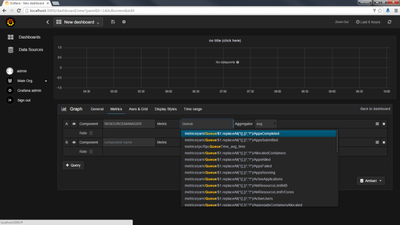
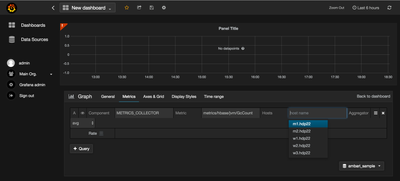
Once Grafana is accessible, design your dashboard. Below are few sample screenshots:
Created 02-10-2016 12:59 PM
- Mark as New
- Bookmark
- Subscribe
- Mute
- Subscribe to RSS Feed
- Permalink
- Report Inappropriate Content
Created on 02-10-2016 01:04 PM - edited 08-19-2019 05:42 AM
- Mark as New
- Bookmark
- Subscribe
- Mute
- Subscribe to RSS Feed
- Permalink
- Report Inappropriate Content
Created 02-10-2016 01:16 PM
- Mark as New
- Bookmark
- Subscribe
- Mute
- Subscribe to RSS Feed
- Permalink
- Report Inappropriate Content
What is your ambari and HDP version. Try generating graph for some other component like Resourcemanager. Also try deleting stale hosts/services from ambari.
Created on 02-10-2016 01:44 PM - edited 08-19-2019 05:42 AM
- Mark as New
- Bookmark
- Subscribe
- Mute
- Subscribe to RSS Feed
- Permalink
- Report Inappropriate Content
I have ambari Version2.2.0.0 and hdp stack 2.3.4.0.
I tried for other metrics for Resourcemanager but getting some weird error.
Problem! Unable to compile query predicate: Invalid Query Token: token='(', previous token type=VALUE_OPERAND.
Created 02-11-2016 02:14 PM
- Mark as New
- Bookmark
- Subscribe
- Mute
- Subscribe to RSS Feed
- Permalink
- Report Inappropriate Content
Metrics for which you are trying to generate the graph needs to be edited manually.
Enter "metrics/yarn/Queue/root/AvailableMB" in metric box while selecting Resourcemanager
Similarly for child queue of root viz child1 you have to enter metrics/yarn/Queue/root/child1/AvailableMB
I have tested this on ambari Version 2.2.0.0 with hdp stack 2.3.4.0.
- « Previous
-
- 1
- 2
- Next »


