Support Questions
- Cloudera Community
- Support
- Support Questions
- Re: kileld application not showing up in history s...
- Subscribe to RSS Feed
- Mark Question as New
- Mark Question as Read
- Float this Question for Current User
- Bookmark
- Subscribe
- Mute
- Printer Friendly Page
- Subscribe to RSS Feed
- Mark Question as New
- Mark Question as Read
- Float this Question for Current User
- Bookmark
- Subscribe
- Mute
- Printer Friendly Page
kileld application not showing up in history server
- Labels:
-
Apache YARN
-
MapReduce
Created on 05-03-2019 09:10 AM - edited 09-16-2022 07:21 AM
- Mark as New
- Bookmark
- Subscribe
- Mute
- Subscribe to RSS Feed
- Permalink
- Report Inappropriate Content
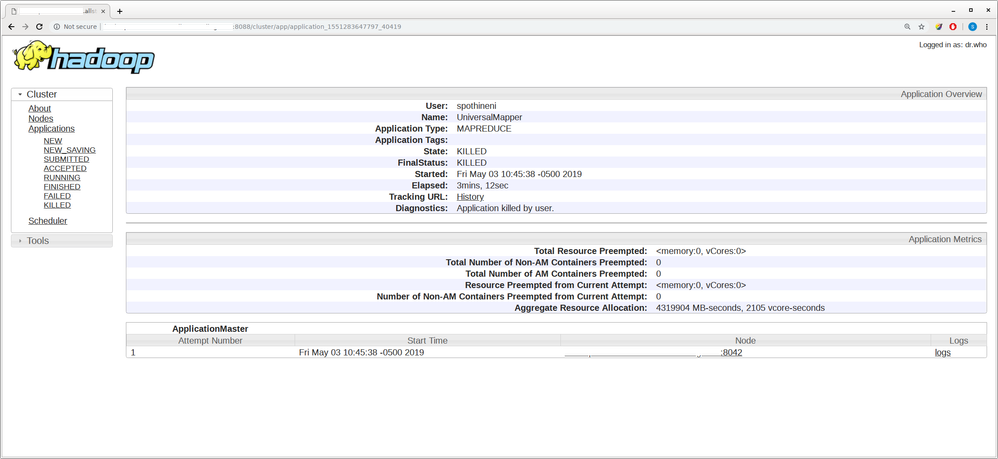
I kiiled Yarn mapreduce application manually, after 50% mappers finished, I can see the mappers in Resource Manager UI while the job is in porgress, but after I killed application, I can not see the tasks window any more "Tracking URL: History" not progressing to next window.
Same time this application not showing up in history server.
Using Cloudera enterprise 5.14.0
How can I diagnose issue, I ddin't see any exception in logs?
Also how can get rid of following message:
2019-05-03 04:58:32,835 INFO org.apache.hadoop.yarn.server.webproxy.WebAppProxyServlet: dr.who is accessing unchecked http://XXXm:44182/ws/v1/mapreduce/jobs/job_1551283647797_40054 which is the app master GUI of application_1551283647797_40054 owned by spothineni
Created 05-11-2019 05:53 PM
- Mark as New
- Bookmark
- Subscribe
- Mute
- Subscribe to RSS Feed
- Permalink
- Report Inappropriate Content
Have you tried to get the logs from command line?
For secured cluster, run as "yarn" superuser:
yarn logs -applicationId {application_id} -appOwner {username}
For unsecured cluster, run as "root" superuser:
sudo -u yarn yarn logs -applicationId {application_id}
Will you get the result? Without seeing errors, it would be hard to tell why you don't see next page when clicking "History" button on that page, it can be caused by lots of factors.
Cheers
Eric
Created on 05-13-2019 07:18 AM - edited 05-13-2019 11:30 AM
- Mark as New
- Bookmark
- Subscribe
- Mute
- Subscribe to RSS Feed
- Permalink
- Report Inappropriate Content
Thanks for the reply.
I already tried yarn cli, its giving only the AM container log, seems it couldn't aggregate the other containers.
when a job is killed from Hue, job State: KILLED, FinalStatus: KILLED, should it complete the log aggregation for killed application?
Created 07-17-2019 08:41 AM
- Mark as New
- Bookmark
- Subscribe
- Mute
- Subscribe to RSS Feed
- Permalink
- Report Inappropriate Content
Hi,
Is the issue happens for only one particular job?
Thx
AKR
Created on 07-17-2019 09:09 AM - edited 07-17-2019 09:23 AM
- Mark as New
- Bookmark
- Subscribe
- Mute
- Subscribe to RSS Feed
- Permalink
- Report Inappropriate Content
Any "manually" killed application not showing up in the history server. In resource manager I am not able to browse the tasks. We care using Cloudera 5.14.X
Any application killed by yarn does show up in history server and able to browse tasks in resource manager.


