Support Questions
- Cloudera Community
- Support
- Support Questions
- problem with yarn from ambari dashboard
- Subscribe to RSS Feed
- Mark Question as New
- Mark Question as Read
- Float this Question for Current User
- Bookmark
- Subscribe
- Mute
- Printer Friendly Page
- Subscribe to RSS Feed
- Mark Question as New
- Mark Question as Read
- Float this Question for Current User
- Bookmark
- Subscribe
- Mute
- Printer Friendly Page
problem with yarn from ambari dashboard
- Labels:
-
Apache Ambari
-
Apache Hadoop
-
Apache YARN
Created on 10-25-2017 08:05 AM - edited 08-17-2019 06:13 PM
- Mark as New
- Bookmark
- Subscribe
- Mute
- Subscribe to RSS Feed
- Permalink
- Report Inappropriate Content
what could be the reason that yarn memory is very high?
any suggestion to verify this?
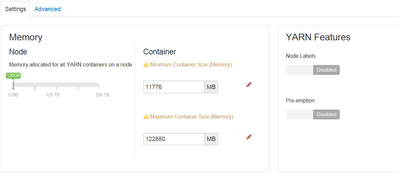
we have this value from ambari
yarn.scheduler.capacity.root.default.user-limit-factor=1
yarn.scheduler.minimum-allocation-mb=11776
yarn.scheduler.maximum-allocation-mb=122880
yarn.nodemanager.resource.memory-mb=120G
 /usr/bin/yarn application -list -appStates RUNNING | grep  RUNNING


  Thrift JDBC/ODBC Server                SPARK          hive         default                 RUNNING               UNDEFINED                  10%
  Thrift JDBC/ODBC Server                SPARK          hive         default                 RUNNING               UNDEFINED                  10%
  mcMFM                                  SPARK          hdfs         default                 RUNNING               UNDEFINED                  10%
  mcMassRepo                             SPARK          hdfs         default                 RUNNING               UNDEFINED                  10%
  mcMassProfiling                        SPARK          hdfs         default                 RUNNING               UNDEFINED


free -g
              total        used        free      shared  buff/cache   available
Mem:             31          24           0           1           6           5
Swap:             7           0           7
Created 10-25-2017 08:41 AM
- Mark as New
- Bookmark
- Subscribe
- Mute
- Subscribe to RSS Feed
- Permalink
- Report Inappropriate Content
If you have not set it on your own then , I guess based on the Stack Advisor script as:
putYarnProperty('yarn.nodemanager.resource.memory-mb', int(round(min(clusterData['containers'] * clusterData['ramPerContainer'], nodemanagerMinRam))))
.
Created 10-25-2017 09:58 AM
- Mark as New
- Bookmark
- Subscribe
- Mute
- Subscribe to RSS Feed
- Permalink
- Report Inappropriate Content
Jay not in this issue , but I will happy to get tour answer about my quastion from - https://community.hortonworks.com/questions/142356/how-to-recover-the-standby-name-node-in-ambari-cl...
- « Previous
-
- 1
- 2
- Next »


