Our Community is getting an upgrade! To get everything ready for the relaunch, we’ll be placing the site in read-only mode starting September 21st.
We really appreciate your understanding while we get things set up behind the scenes. Catch up on all the exciting details about the move here.
Need help or have questions? Drop us a line at [email protected]

What's New @ Cloudera

Find the latest Cloudera product news
Announcements
Share your experience with Cloudera on G2 and get a $25 Amazon Gift card.
Hi, I'm CLEO! Something exciting is coming to the Community. Stay Tuned!

Cloudera Cloudera AI now provides built-in monitoring dashboard for deployed CML Models

avatar
Super Collaborator

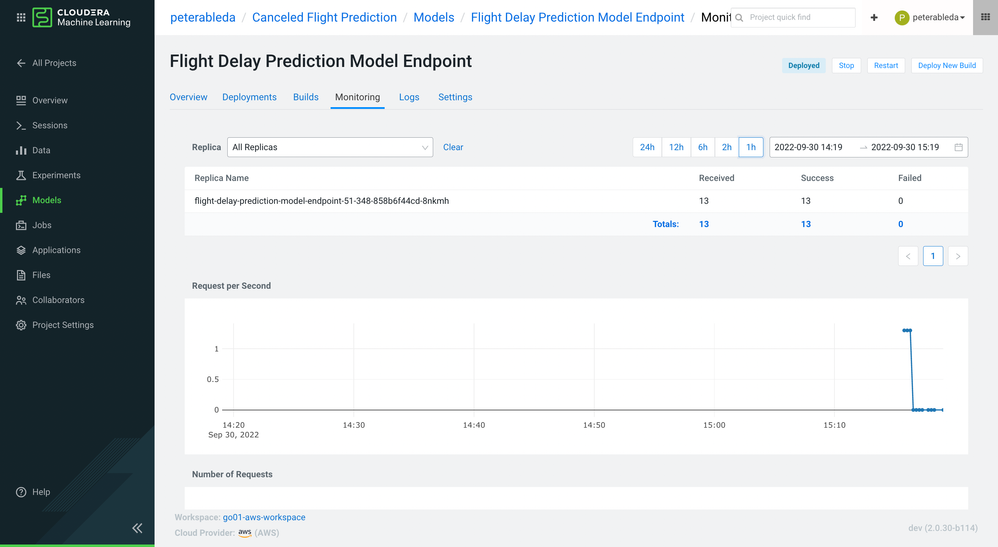
Cloudera Cloudera AI now provides a built-in dashboard for monitoring technical metrics relating to deployed CML Models, such as request throughput, latency, and resource consumption.


When machine learning models are deployed in production, it’s essential to know whether the model is successfully providing responses to all queries within the required timeframe and to be able to investigate and find the root cause for any failed responses or other downstream issues. Further, it can be challenging to know ahead of time the resource requirements for the model, such as the number of replicas, and amount of memory and CPU allocated to each replica. This can make it difficult to find the balance between the risk of underprovisioning resources leading to slow responses or timed out requests, and the risk of unnecessarily wasting resources that could be used for other workloads.


peter_ableda_0-1664543962647.png


The new monitoring features for CML Models provide observability that makes these challenges much easier to manage, allowing ML Engineers to be confident that their Model is right-sized and performing within SLAs. The dashboard is available to any end-user with access to the Model, and allows users to view these technical metrics over custom time windows, either aggregated or per-replica, making it easier for developers to understand the resource needs of their Models and monitor the health of production deployments.


To view the dashboard, select the Monitoring tab of the deployed Model.