
Our Community is getting an upgrade! To get everything ready for the relaunch, we’ll be placing the site in read-only mode starting September 21st.
We really appreciate your understanding while we get things set up behind the scenes. Catch up on all the exciting details about the move here.
Need help or have questions? Drop us a line at [email protected]

Archives of Support Questions (Read Only)
- Cloudera Community
- Board Archive
- Archives of Support Questions (Read Only)
- Ambari Metrics link (grafana) not available on HDP...
- Subscribe to RSS Feed
- Mark Question as New
- Mark Question as Read
- Float this Question for Current User
- Bookmark
- Subscribe
- Mute
- Printer Friendly Page
- Subscribe to RSS Feed
- Mark Question as New
- Mark Question as Read
- Float this Question for Current User
- Bookmark
- Subscribe
- Mute
- Printer Friendly Page
Ambari Metrics link (grafana) not available on HDP 2.5 sandbox
- Labels:
-
Apache Ambari



Created on 07-05-2016 03:44 AM - edited 08-19-2019 04:14 AM
- Mark as New
- Bookmark
- Subscribe
- Mute
- Subscribe to RSS Feed
- Permalink
- Report Inappropriate Content
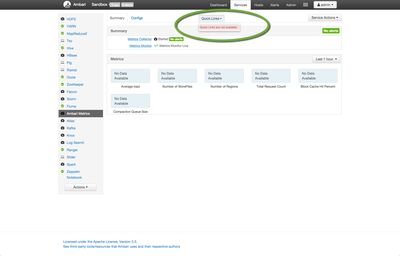
The link is unavailable on hdp 2.5 sandbox. Any ideas why? What port is the dashboard available on so I can hit the url directly instead of going from ambari... Possible?


Created 07-05-2016 07:50 PM
- Mark as New
- Bookmark
- Subscribe
- Mute
- Subscribe to RSS Feed
- Permalink
- Report Inappropriate Content
You can enable Grafana on the Tech Preview with these steps..
Execute the first 2 steps inside SSH Web Client (http://127.0.0.1:4200). you will need to replace "admin:admin" with the username:password you chose and then replace "ambari.server" with 127.0.0.1 (or whichever host you've installed it on) and "cluster.name" with the name of the cluster "Sandbox" by default (case-sensitive). "host.name" for step#2 would most likely be "sandbox.hortonworks.com" unless you have changed it.
- Add the METRICS_GRAFANA component to Ambari:
curl -u admin:admin -H "X-Requested-By:ambari" -i -X POST
http://ambari.server:8080/api/v1/clusters/cluster.name/services/AMBARI_METRICS/components/METRICS_GR...
- Add METRICS_GRAFANA to a host in the cluster.
curl -u admin:admin -H "X-Requested-By:ambari" -i -X POST -d '{"host_components":[{"HostRoles":{"component_name":"METRICS_GRAFANA"}}]}' http://ambari.server:8080/api/v1/clusters/cluster.name/hosts?Hosts/host_name=host.name - From Ambari Web, browse to Services > Ambari Metrics and you will see Grafana is in the Install Pending… state. You need to complete the configuration of Grafana before installing and starting.
- To complete the configuration, click on Services > Ambari Metrics > Configs and you will need to enter the default Grafana Admin Password in the General section. Click Save.
- Browse to Hosts > host.name (i.e. the host.name used in the API call where you added Grafana). You will see the Grafana component is in an Install Pending… state. Use the Install Pending… action button and select Re-install.
- Once the install operation completes, select Start to start Grafana.
- To access Grafana, browse to Services > Ambari Metrics, select Quick Links and then choose Grafana.
- In VirtualBox, right click on your Sandbox VM > Settings > Network > Adapter 1 > Advanced > Port Forwarding
Add the following 2 ports to be forwarded(top right icon with a + in it)
name: grafana, protocol: TCP, HOST IP : 127.0.0.1, HOST Port: 3000, Guest Port: 3000
name: collector, protocol: TCP, HOST IP: 127.0.0.1, HOST Port: 6188, Guest Port: 6188
You should be able to access Grafana directly from http://127.0.0.1:3000/ now.


Created 07-05-2016 06:29 PM
- Mark as New
- Bookmark
- Subscribe
- Mute
- Subscribe to RSS Feed
- Permalink
- Report Inappropriate Content
@Sunile Manjee
Grafana is not yet installed on HDP2.5 technical preview. It will be installed and tested very soon. @rmolina, please check out this.
Created 07-05-2016 07:50 PM
- Mark as New
- Bookmark
- Subscribe
- Mute
- Subscribe to RSS Feed
- Permalink
- Report Inappropriate Content
You can enable Grafana on the Tech Preview with these steps..
Execute the first 2 steps inside SSH Web Client (http://127.0.0.1:4200). you will need to replace "admin:admin" with the username:password you chose and then replace "ambari.server" with 127.0.0.1 (or whichever host you've installed it on) and "cluster.name" with the name of the cluster "Sandbox" by default (case-sensitive). "host.name" for step#2 would most likely be "sandbox.hortonworks.com" unless you have changed it.
- Add the METRICS_GRAFANA component to Ambari:
curl -u admin:admin -H "X-Requested-By:ambari" -i -X POST
http://ambari.server:8080/api/v1/clusters/cluster.name/services/AMBARI_METRICS/components/METRICS_GR...
- Add METRICS_GRAFANA to a host in the cluster.
curl -u admin:admin -H "X-Requested-By:ambari" -i -X POST -d '{"host_components":[{"HostRoles":{"component_name":"METRICS_GRAFANA"}}]}' http://ambari.server:8080/api/v1/clusters/cluster.name/hosts?Hosts/host_name=host.name - From Ambari Web, browse to Services > Ambari Metrics and you will see Grafana is in the Install Pending… state. You need to complete the configuration of Grafana before installing and starting.
- To complete the configuration, click on Services > Ambari Metrics > Configs and you will need to enter the default Grafana Admin Password in the General section. Click Save.
- Browse to Hosts > host.name (i.e. the host.name used in the API call where you added Grafana). You will see the Grafana component is in an Install Pending… state. Use the Install Pending… action button and select Re-install.
- Once the install operation completes, select Start to start Grafana.
- To access Grafana, browse to Services > Ambari Metrics, select Quick Links and then choose Grafana.
- In VirtualBox, right click on your Sandbox VM > Settings > Network > Adapter 1 > Advanced > Port Forwarding
Add the following 2 ports to be forwarded(top right icon with a + in it)
name: grafana, protocol: TCP, HOST IP : 127.0.0.1, HOST Port: 3000, Guest Port: 3000
name: collector, protocol: TCP, HOST IP: 127.0.0.1, HOST Port: 6188, Guest Port: 6188
You should be able to access Grafana directly from http://127.0.0.1:3000/ now.
Created 07-06-2016 05:17 PM
- Mark as New
- Bookmark
- Subscribe
- Mute
- Subscribe to RSS Feed
- Permalink
- Report Inappropriate Content
hmmm wow. nice work.

Created 03-29-2017 07:05 AM
- Mark as New
- Bookmark
- Subscribe
- Mute
- Subscribe to RSS Feed
- Permalink
- Report Inappropriate Content
I meet this question after upgrading from 2.3 to 2.5, then now it's solved by this workarround.


