Community Articles
- Cloudera Community
- Support
- Community Articles
- Apache Storm Topology Tuning Approach
- Subscribe to RSS Feed
- Mark as New
- Mark as Read
- Bookmark
- Subscribe
- Printer Friendly Page
- Report Inappropriate Content
- Subscribe to RSS Feed
- Mark as New
- Mark as Read
- Bookmark
- Subscribe
- Printer Friendly Page
- Report Inappropriate Content
Created on 10-21-2016 09:11 PM - edited 08-17-2019 08:42 AM
Introduction
How many times we've heard that a problem can't be solved if it isn't completely understood? However, all of us, even when having a lot of experience and technical skill, we still tend to jump to the solution workspace by-passing key steps in the scientific approach. We just don’t have enough patience and, quite often, the business is on our back to deliver a quick fix. We just want to get it done! We found ourselves like that squirrel in the Ice Age chasing for the acorn just using our experience and minimal experiment, dreaming that the acorn will fall on our lap. This article is meant to re-emphasize a repeatable approach that can be applied to tune Storm topologies starting from understanding the problem, forming a hypothesis, testing that hypothesis, collecting the data, analyzing the data, drawing conclusions based on facts and less on empirical. Hopefully it helps to catch more acorns!
Understand the Problem
Understand the functional problem resolved by the topology; quite often the best tuning is executing a step differently in the workflow for the same end-result, maybe apply a filter first and then execute the step, rather executing the step forever and paying the penalty every time. You can also prioritize success or learn to lose in order to win. This is the time also to get some sense of business SLA and forecasted growth. Document the SLA by topology. Try to understand the reasons behind the SLA and identify opportunities for trade-offs.
Define SLA for Business Success
This is the time also to get some sense of business SLA and forecasted growth. Document the SLA by topology. Try to understand the reasons behind the SLA and identify opportunities for trade-offs.
Gather Data
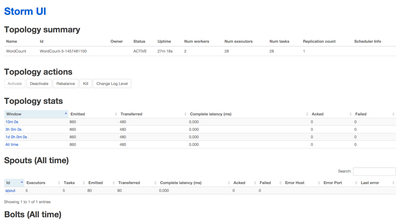
Gather data using Storm UI and other tools specific to the environment. Storm UI is your first to go-to tool for tuning, most of the time.
Another tool to use is Storm’s builtin Metrics-Collecting API. This is available with 0.9.x. This helps to built-in metrics in your topology. You may have tuned it, deployed the production, everybody is happy and two days later the issue comes back. Wouldn’t be nice to have some metrics embedded on your code, already focused on the usual suspects, e.g. external calls to a web service or a SQL to your lookup data store, specific customers or some other strong business entity that due to data and the workflow can become the bottleneck?
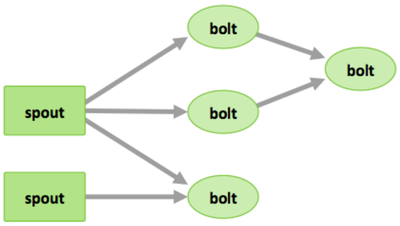
In a storm topology, you have spouts, bolts, workers that can play a role in your topology challenges.
Learn about topologies status, uptime, number of workers, executors, tasks, high-level stats across four time windows, spout statistics, bolt statistics, visualization of the spouts and the bolts and how they are connected, the flow of tuples between all of the streams, all configurations for the topology.
Define Baseline Numbers
- Document statistics about how the topology performs in production.
- Setup a test environment and try that topology with different loads aligned to realistic business SLAs.
Tuning Options vs. Bottleneck
- Increase parallelism (use rebalance command), analyze the change in capacity using the same Storm UI – if no improvement, focus on the bolt, that is the likely bottleneck; if you see backlog in your upstream (Kafka most likely), focus on the spout. After trying with spouts and bolts, change focus on workers’ parallelism. Basic principle is to scale on a single worker with executors until you find increasing executors does not work anymore. If adjusting spout and bolt parallelism failed to provide additional benefits, play with the number of workers to see if we are now bound by the JVM we were running on and needed to parallelize across JVMs.
- If you still don’t meet the
SLA by tuning the existent spouts, bolts, and workers, it’s time to start controlling
the rate that flows into topology.
- Max spout pending allows you to set a maximum number of tuples that can be unacked at any given time. If the number of possible unacked tuples is lower than the total parallelism you’ve set for your topology, then it could be a bottleneck. The goal is with one or many spouts to assure that the maximum possible unacked tuples is greater than the maximum number of tuples we can process based on our parallelization so we can feel safe saying that max spout pending isn’t causing a bottleneck. Without Max spout pending, tuples will continue to flow into your topology whether or not you can keep up with processing them. Max spout pending allows to control the ingest rate. Max spout pending lets us erect a dam in front of our topology, apply back pressure, and avoid being overwhelmed. Despite the optional nature of max spout pending, you always should set it.
- When attempting to increase performance to meet an SLA, increase the rate of data ingest by either increasing spout parallelism or increasing the max spout pending. Assuming a 4x increase in the maximum number of active tuples allowed, we’d expect to see the speed of messages leaving our queue increase (maybe not by a factor of four, but it’d certainly increase). If that caused the capacity metric for any of the bolts to return to one or near it, tune the bolts again and repeat with the spout and bolt until hit the SLA.
These methods can be applied over and over until meet the SLAs. This effort is high and automating steps is desirable.
Deal with External Systems
It’s easy when interacting with external services (such as a SOA service, database, or filesystem) to ratchet up the parallelism to a high enough level in a topology that limits in that external service keep your capacity from going higher. Before you start tuning parallelism in a topology that interacts with the outside world, be positive you have good metrics on that service. You could keep turning up the parallelism on bolt to the point that it brings the external service to its knees, crippling it under a mass of traffic that it’s not designed to handle.
Latency
Let’s talk about one of the greatest enemies of fast code: latency. There’s latency accessing local memory and hard drive, and accessing another system over the network. Different interactions have different levels of latency, and understanding the latency in your system is one of the keys to tuning your topology. You’ll usually get fairly consistent response times and all of the sudden those response times will vary wildly because of any number of factors:
- The external service is having a garbage collection event.
- A network switch somewhere is momentarily overloaded.
- Your coworker wrote a runaway query that’s currently hogging most of the database’s CPU.
- Something about the data that’s likely to cause the delay.
As the topology interacts with external services, let’s be smarter about our latency. We don't always need to increase parallelism and allocate more resources. We may discover after investigation that your variance is based on customer or induced by an exceptional event, e.g. elections, Olympics, etc. Certain records are going to be slower to look up.
Sometimes one of those “fast” lookups might end up taking longer. One strategy that has worked well with services that exhibit this problem is to perform initial lookup attempts with a hard ceiling on timeouts, try various ceilings, if that fails, send it to a less parallelized instance of the same bolt that will take longer with its timeout. The end result is that the time to process a large number of messages goes down. Your mileage will vary with this strategy, so test before you use it.
As part of your tuning strategy, you could end-up to break a bolt into two: one for fast lookups and the other for slow lookups. At least, what goes fast let it go fast, don’t back it up with a slow one. Treat the slow ones differently and make sure they are the exception. You may even decide to address those differently and still get some value of that data. It is up-to you to determine what is more important: having an overall bottleneck or mark for later processing or disregard those producing a bottleneck. Maybe a batch approach for those is more efficient. This is a design consideration and a reasonable trade-off most of the time. Are you willing to accept the occasional loss of fidelity but still hit the SLA because that is more important for your business? Is Perfection helping or killing your business?
Summary
- All basic timing information for a topology can be found in the Storm UI.
- Metrics (both built-in and custom) are essential if you want to have a true understanding of how your topology is operating.
- Establishing a baseline set of performance numbers for your topology is the essential first step in the tuning process.
- Bottlenecks are indicated by a high capacity for a spout/bolt and can be addressed by increasing parallelism.
- Increasing parallelism is best done in small increments so that you can gain a better understanding of the effects of each increase.
- Latency that is both related to the data (intrinsic) and not related to the data (extrinsic) can reduce your topology’s throughput and may need to be addressed.
- Be ready for trade-offs
References
Storm Applied: Strategies for real-time event processing by Sean T. Allen, Matthew Jankowski, and Peter Pathirana


